Aug. 2021 update: see how I-System navigated the July 2021 events in U.S. Treasuries markets that left most experts “dazed and confused,” scrambling for answers. By contrast, I-System strategies generated profitable trades. Click here for a summary of the episode.
Our track record: consistently outperforming our relevant benchmarks since 2007
We’ve demonstrated I-System’s effectiveness in the most rigorous way possible: by comparing its performance to many of the world’s leading trend followers – the “managed futures” funds or Commodity Trade Advisors (CTAs).
Outperforming Blue Chip CTA Hedge Funds (2007-2013)
In 2007 we set up Galstar Derivatives Trading (GDT) to manage a diversified futures trading portfolio similar to that of many typical CTAs. GDT’s trading was based exclusively on I-System strategies. Between 2007 and 2013, we outperformed the index of world’s top rated CTAs, Dow Jones Credit Suisse (DJCS) Managed Futures Blue Chip index.[1]

While the “correctness” of any single trading decision cannot be measured, Galstar track record spanned a period of six years, used 120 I-System strategies in 38 different financial and commodity markets and included close to ten thousand individual trades. This is a robust reflection of the model’s quality and effectiveness in generating profits from market trends. Our more recent results in crisis periods are detailed below.
Outperforming tail-risk funds with Altana Inflation Trends Fund
From 2011 to 2019 we used the I-System to manage a tail-event hedge portfolio under Altana Inflation Trends Fund (AITF). A tail risk portfolio is typically a smaller investment vehicle designed to hedge a specific risk exposure in a different, much larger portfolio. As such tends to have a much more aggressive risk profile. Thankfully, EurekaHedge tracks a Tail Risk index and over the same time period, AITF outperformed that index by 4 percentage points.
How we navigated through various episodes of market turmoil
While we could enumerate dozens of examples, the following selection is indicative of I-System’s performance through unpredictable and unforeseen market events.
– The 2008 financial crisis: most investors sustained severe losses through 2008/09 bear market. With I-System strategies we generated substantial profits short selling the market, ending the year with a 27% positive net return.
– Late 2015/early 2016 stock market correction: at the time, equity markets shed about 15%. At that decline’s trough, Altana Inflation Trends Fund gained 19.6% net of fees.
– December 2018 market correction: when the S&P 500 dropped 9.03% AITF gained 9.98% net of fees.
Over the years the markets have put I-System through some severel trials. A few episodes are summarized below.
I-System and the 2020 oil price collapse
In July 2019 one of our prospective customers asked us to put together a portfolio of strategies trading crude oil and oil derivatives (these strategies are included in our TrendCompass Major Markets and Energy portfolios). This experience proved once more the reliability and effectiveness of the I-System as the following chart illustrates:

I-System continued generating superb trading signals through 2020 as we documented in this article. Incidentally, this experience included an unforeseen event, which triggered the largest-ever 1-day jump in oil prices on Monday, 16 September 2020. This event offered a good case to address the objection many people raise with respect to quantitative trading systems in general: how can your model ‘know’ if some unforeseen event happens and derails prices? For a brief discussion of this issue, check our FAQ page.
Consistent performance when it matters most!
In oil markets, extreme price events have been increasingly frequent in the recent years, but market experts have invariably failed to predict them. By contrast, I-System has successfully navigated these events, consistently and reliably capturing value from them. The next chart illustrates the performance of 12 I-System strategies included in our Major Markets portfolio since 2014, showing a few forecasts by various market analysts over this time.

I-System and COMEX Copper
Copper is an important indicator of the overall economic activity. Given the pervasive uncertainty through much of 2019 and 2020, the price of Copper has staged two major trend reversals – never a good environment for trend followers. Nonetheless, as the prices rallied through the summer of 2020, I-System strategies have again proven their worth.
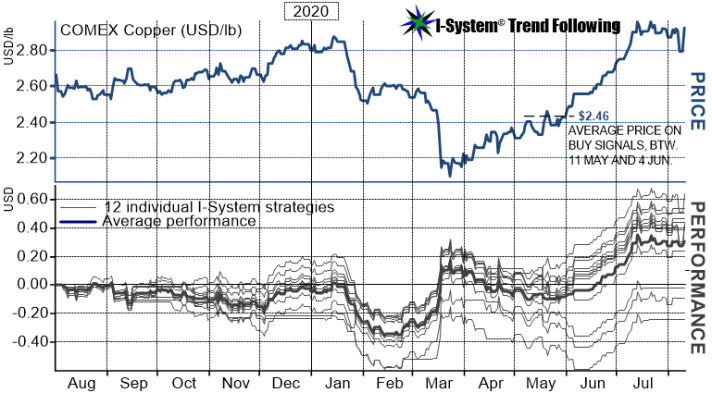
Three of the above strategies had negative performance over the 12 months covered shown in the chart. But the remaining nine have done superbly well, bringing the average performance for the year to $0.31/lb, equivalent to $7,750 per contract.
Navigating the unpredictable 2019-2020 yields roller-coaster
In January 2019 the Wall Street Journal polled a group of prominent market analysts, asking them to predict the yields on U.S. 10-year Treasury Notes for mid-year 2019 and the year-end. At the time, the yield was around 2.65% and most experts expected it to rise through the year. Their predictions are illustrated in the chart below, compared to the actual change in yield:
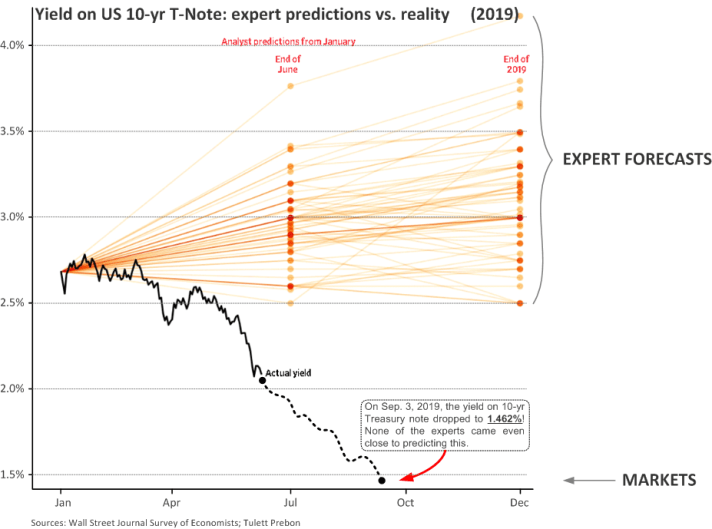
While analyst forecasts ranged from 2.5% to 4.2%, by September the yields fell below 1.5% and remained under 2% for the rest of the year. None of the experts came even close to predicting this outcome. This experience is an example of the pervasive problem of uncertainty in business and investing.
I-System navigates with flying colors
While the experts polled by Wall Street Journal failed to predict the yields of 10-year T-Notes, we actually traded 10-yr T-Note futures (TY) during this period. Our performance is illustrated in the chart below:

How did we ‘know’?
As the above chart shows, we traded TY on the short side starting in Q4 2017, then in October and November 2018 we gradually reversed to the long side and remained long through Sep. 2019, generating strong positive performance since mid-2017.
To achieve this, we did not need to know anything at all about the economic conditions affecting the US treasuries and interest rates, about central bank or government policies, GDP, employment, inflation, or any other factor. Simply, we traded the TY along with the prevailing market trends. We were able to do this by using a set of intelligent I-System trend following strategies. In this same way we also traded the 30-year Treasury Bond and the German Bund, achieving very similar results.

I-System and the 2018 oil price collapse
For commodity-related businesses, large-scale price events represent one of the greatest sources of risk. Because such events invariably unfold as trends, I-System strategies can help such firms navigate price fluctuations profitably and confidently. Recent case in point was the sharp, 40% oil price collapse at the end of 2018. This event caused severe losses for a number of oil companies.[2] Again our strategies navigated the events superbly well. The following chart shows our results trading NYMEX crude oil (WTI) futures:
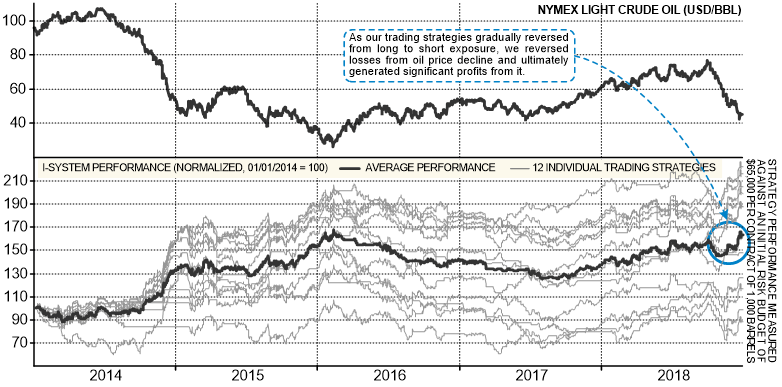
Using a set of 12 I-System trading strategies we have successfully navigated the volatile price fluctuations and turned adverse oil market conditions in late 2018 to our advantage and profit. With the price correction unfolding, our strategies gradually reversed from long to short exposure, on average at $60.66/bbl on WTI and $69.04 on Brent and generated significant profits through 31 December 2018.
I-System and the 2018 stock market turmoil
I-System strategies can also help investors avoid losses (and profit from) sharp equity market corrections and bear markets. As our track-record shows, we generated positive +27% net return through the last bear market in 2008. I-System proved its worth again when, at the end of 2018 major equity indexes declined by almost 20%. Our strategies performed as expected, generating profits in equity index futures and generating a +9.98% positive net performance for December 2018. The chart below illustrates of our trading in S&P 500 Mini futures contract:
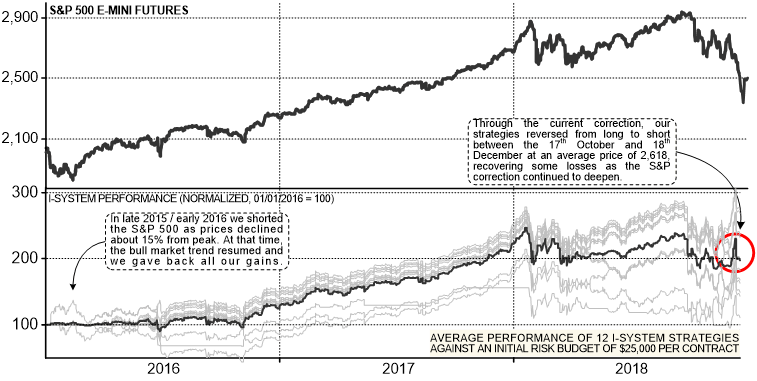
I-System started generating sell signals on 17 Oct. at 2,816 price level. Gradually we closed out our long positions entirely and shifted to net short exposure at an average selling price of 2,618. At market close on 31 December, our short position was priced at 2,580.63 on average, implying a 75 points profit or $3,769 per contract.
These results testify to the quality of the I-System as a model and to the effectiveness of its strategies in capturing value from market trends. When a major economic crisis begins to impact securities prices – whether in financial, currency or commodities markets, I-System strategies have proven to pick up the emerging trends and trade them profitably.
The above chart incidentally also conveys a fair illustration of the way typical trend-following strategies perform over time: they generate strong trading gains while markets trend, but tend to stall or generate losses when trends correct, reverse, or when price fluctuations remain confined in a horizontal range. With S&P 500, this took place through 2018. Visibly, some of our strategies performed negatively in this environment. But even at that, the strength and reliability of the I-System performance may remain stable until a new trend cycle gathers momentum.
Notes:
[1] DJCS Blue Chip Managed Futures index comprised the following hedge funds: Aspect Diversified Fund Ltd (USD), BlueTrend Fund Ltd (USD – Class B), Boronia Diversified Fund Limited, Campbell Global Assets Fund Ltd (Class A) Lynx (Bermuda) Ltd., Quantitative Global Fund, Ltd (Class D 1X), Roy G. Niederhoffer Fund (Ireland) Plc, Winton Futures Fund Ltd (Class B). DJCS stopped tracking the Blue Chip Hedge Fund indices as of 31 March 2014.
