The market for U.S. Treasury securities is the single largest market in the world. It sets the interest rates on American government debt which is the most important price in the global markets and as such kept under a microscope by an army of analysts worldwide. Recently a relatively minor drop in yields left the experts stumped – but not the trend followers. Below is a 14-minute video review of the episode and a summary transcript:
For nearly four decades, the steady decline in US Treasury yields has formed the bedrock of our “normal” – the environment that’s shaped our ideas about the economy, about markets and about investing.

Naturally, countless analysts around the world pay very close attention to this market. Over the recent weeks, a relatively minor decline in yields seemingly caught most of them off guard, triggering a lively debate among the experts about what might have caused it. In a recent article titled, “Here’s What Wall Street Thinks is Behind the Shocking Plunge in Yields,” ZeroHedge condensed the discussion among the most prominent analysts noting that the move left a majority of traders “dazed and confused.” To be sure, the move was a surprise: in my TrendCompass newsletter on 7 July I wrote that it would probably prove weak and limited as it was pushing the real interest rates deeper into negative territory…

“The question that everyone on Wall street wants answered,” wrote ZeroHedge, is “what’s behind the sharp bonds move?” On 8th July 2021, J.P. Morgan’s strategist Jay Berry wrote that the 10-year Treasury yields were 25 basis points too low relative to model-implied fair value with a 3-standard deviation divergence. That was just before they dropped another 10 bps…
Deutsche Bank’s Jim Reid proposed that the move was the result of “supply and demand technicals”: an “extremely rare” confluence of supply and demand conditions in the rates market amid a period of exceptionally strong demand for treasuries from banks and foreigners. The explanations proposed by other market experts – some of them quite wordy and convoluted – included the Fed’s pivot toward monetary tapering, the problem with global savings glut, fear of recession, dilemmas about the Corona vaccines’ efficacy against the new “Delta variant,” speculation about whether the global economies would reopen fully or partially, questions on whether consumer demand would return to pre-pandemic levels, and so on. Reid suggested that we would probably have some clues in a few weeks’ time…
But this whole discussion and the idea that we would have a better understanding about what happened and why in a few weeks’ time is entirely unhelpful to the challenge of making timely and effective forward-looking decisions.
But skilled trend followers caught the move in time…
This episode was yet another case supporting my contention that systematic trend following is the only valid answer to the problem of uncertainty (see the discussion at link): the experts were caught off guard (again) as an important price event unfolded. Rather than wondering why the interest rates dropped 25 bps below some “model-implied fair value,” investors needed the right decisions to navigate the events confidently and to their advantage. Once more, as the experts debated, the critical decision support was available, courtesy of systematic trend following strategies.
Here’s how the I-System navigated the events
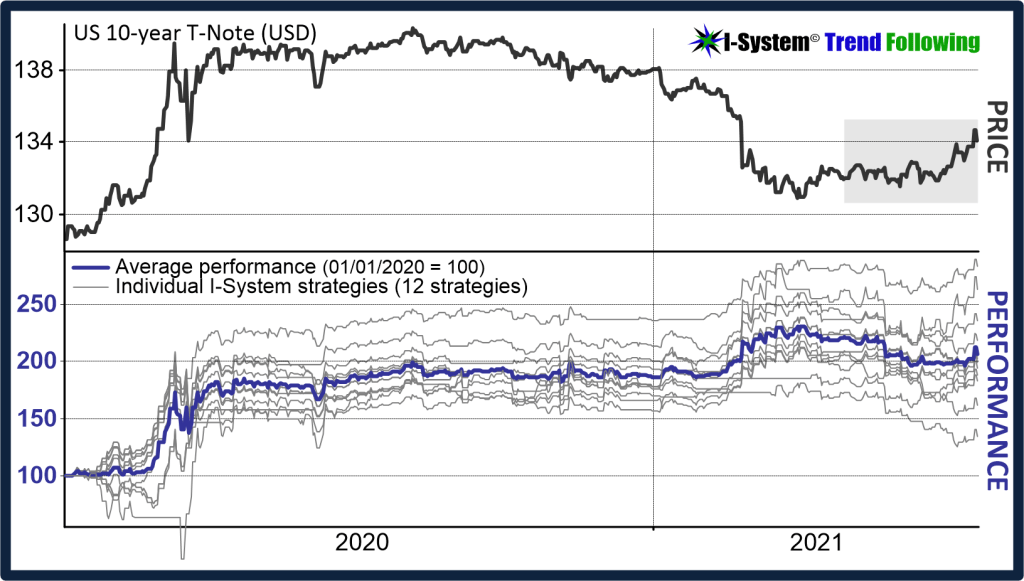
I track the 30-year T-Bond and the 10-year T-Note futures in our TrendCompass reports using a set of 12 I-System strategies in each market to generate daily directional exposure and trading signals. The charts below summarize their performance (with leverage):

The events which stumped the experts all unfolded during the interval shaded grey in the above chart. The chart below summarizes the behavior of I-System strategies in this period:

Through May and June 2021, I-System strategies gradually reduced short exposure and after a series of buy signals turned net long by June 10. As the 30-year Bond’s price continued to rise, they triggered further “buy” signals. As a result, I-System strategies went long at the average price of 160.19 generating decent profits from mid-June onward. A similar sequence of events took place with the 10-year T-Note:
As an aside, I colored the performance of one of our strategies (TY 30.1) in red as it underscores another important point about trend following strategies: TY 30.1 was an outlier and underperformed very badly at the beginning of 2020. But from the moment it bottomed out, it was our top performer. The takeaway is in a population of well-formulated systematic strategies laggards can become top-performers and vice versa, which is why we must always be careful not to eliminate good strategies just because they sustained a losing streak.
The performance uptick in the second half of July was the result of the following trading decisions:

I-System was able to turn these events into profitable trades simply through consistent adherence to a set of tried and tested rules of systematic trend following. Furthermore, its ability to track long-, medium- and short-cycle trends enabled the I-System to navigate the events more nimbly than your average model (according to Morgan Stanley, as of 9th July, the CTAs on the whole were still net short US Treasuries).
This keeps happening…
Two years ago I documented a similar episode involving US Treasury securities where systematic trend following got the market moves right while the experts got it badly wrong. Namely, in January 2019 the Wall Street Journal asked a group of market experts to predict the yields on U.S. 10-year Treasury Notes for mid-year and year-end 2019. At the time, the yield was around 2.65% and most experts thought it would rise through the year.

While analyst forecasts ranged from 2.5% to 4.2%, by September the yields fell below 1.5% and remained under 2% for the rest of the year. None of the experts came even close to predicting this outcome.
Again, I-System strategies navigated superbly well…
At the time, I traded Treasury futures using a set of 22 I-System trend following strategies. Their performance on 10-year T-Note futures (against an arbitrary risk budget of $12,500 per contract) is illustrated in the chart below:

Note, this was not a backtest simulation but live trading results based on a tail-risk portfolio I was managing at the time. As the above chart shows, we traded TY on the short side starting in Q4 2017, then in October and November 2018 we gradually reversed to the long side and remained long through Sep. 2019, generating strong positive performance since mid-2017. By virtue of relying on trend-following strategies I did not need to know anything at all about the economic conditions, central bank or government policies, GDP, employment, inflation, or any other factor. Simply, I sailed with the prevailing market trends using the I-System to navigate. I had similar results with the 30-year Treasury Bond and the German Bund.
So why don’t trend following still get no respect?
While the conventional econometric research tends to produce analyses that can take a great deal of time and effort to digest, systematic trend following produces the ultimate product of market analysis: clear, unambiguous, executable decisions. Furthermore, the effectiveness of systematic decisions can be accurately measured. This trait alone should make them very valuable to investors. But in spite of all this, the expert class continues to regard trend following with a certain disdain as though it does not merit the inclusion in the curriculum of serious market professionals.
The reason for this is not performance-related, but largely cultural: namely, most of today’s market professionals were trained in the Cartesian tradition which validates rigorous scientific method aimed at uncovering linear cause-and-effect relationships that supposedly allow us to understand and explain world events. But the whole objective of investing and managing risk is to generate positive returns, not to craft sophisticated discourses about markets. Evidence and experience strongly suggest that in spite of the enormous resources and intellectual horse-power involved, “fundamentals” research has failed to offer effective and reliable decision support to market participants. Chart analysis and systematic trend following undeniably have.
TrendCompass to the rescue!
For investors, traders and hedgers who would prefer to navigate market events profitably, confidently and with peace of mind, I should cordially invite you to give TrendCompass a try. TrendCompass is based on the I-System which I believe to be the very best trend following model ever built. It tracks long-, medium- and short-cycle trend in over 200 financial and commodity futures with no dilution in quality and focus, delivering reliable and effective decision support daily. In continuous use since 2003, I-System has never failed to capture profits from large-scale price events, enabling me to consistently outperform my strategy benchmarks, including the Blue-Chip CTAs (2007-2013, audited by KPMG).
TrendCompass delivers consistent, dependable and effective decision support every day. The cost of subscription is a small fraction of what even an entry market analyst would cost you and in line with moderately priced newsletters published by world’s leading research institutions and analysts.
Sign up for a 1-month free trial of I-System TrendCompass!
One of the best trend following newsletters on the market, I-System TrendCompass delivers consistent, dependable and effective decision support daily, based on I-System trend following strategies covering over 200 key financial and commodities markets with no dilution in quality or focus.
- Cut the information overload
- Get real-time CTA intelligence in seconds per day
- Never miss a major trend move
- Navigate trends profitably, with confidence and peace of mind
One month test-drive is always on us. Sign up for a 1-month FREE trial by e-mailing us at TrendCompass@ISystem-TF.com
To learn more, please visit I-System TrendCompass page.
