Objective: life-long success!
The ultimate objective of I-System Trend Following and of the TrendCompass reports is to turn portfolio management into a life-long success by improving long-term performance through bull and bear cycles and remove stress from investing.
Your wealth, however large or small, should serve you: to improve your quality of life, widen your options and give you greater choices and freedom of movement. An important part of that success is adopting the right investment strategy. Over the long term, trend following has proven to be the most successful and most reliable strategy of investment management. You can read more about trend following at this link: https://isystem-tf.com/trend-following/
What is I-System TrendCompass?
I-System TrendCompass is a daily market report, communicating trading signals for a variety of portfolios of financial and commodity markets. The buy or sell signals are generated by a set of I-System trend following strategies, based upon an analysis of each individual market’s price fluctuations. This is done once a day after the last trading session’s closing price range (open/high/low/close) becomes available. The signals should be executed during the following trading session.
The purpose of the one-month free trial
The purpose of the free one-month trial subscription is to help familiarize you with the TrendCompass reports. Their value as decision support may take much longer to ascertain.
How does trend following work?
Trend following is demonstrably the most effective long-term investing strategy. Even the supposed value investors Benjamin Graham and Warren Buffett owe their success entirely to trend following! If you find that hard to believe, check out our analysis of Graham’s and Buffett’s investment performance. You’ll find it in the article linked below (caution: you’ll find it difficult to disagree!):
Why trend following beats value investing
Still, trend following does require a great deal of patience and discipline. Here’s why: the performance of trend following strategies over time might look like this:
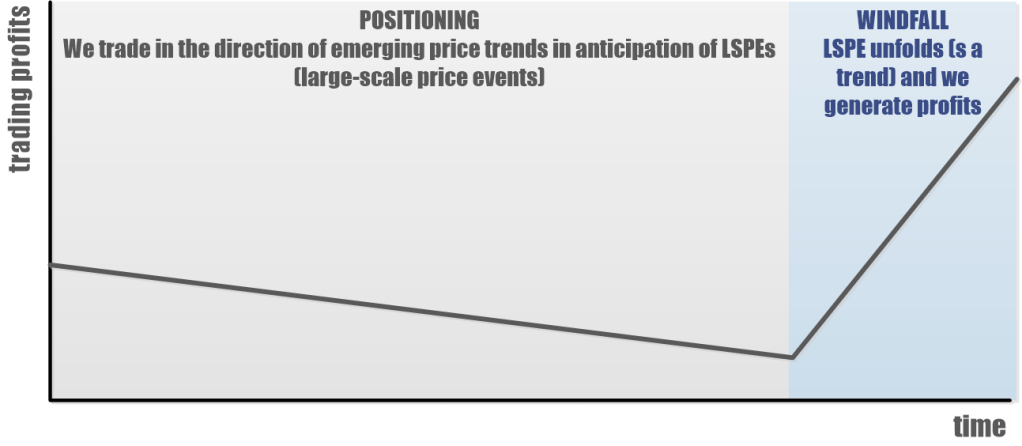
We can’t predict when a trend will take off; we also can’t predict how long it will last, or how high or low the price might reach. But rather than trying to make those predictions, we simply react to price fluctuations as they unfold and position our risk accordingly.
Trend followers believe that markets trend about a third of the time and spend about two thirds correcting and consolidating. Broadly, we believe this is correct. The charts below show a few real-life examples of the performance of our own strategies in different markets:
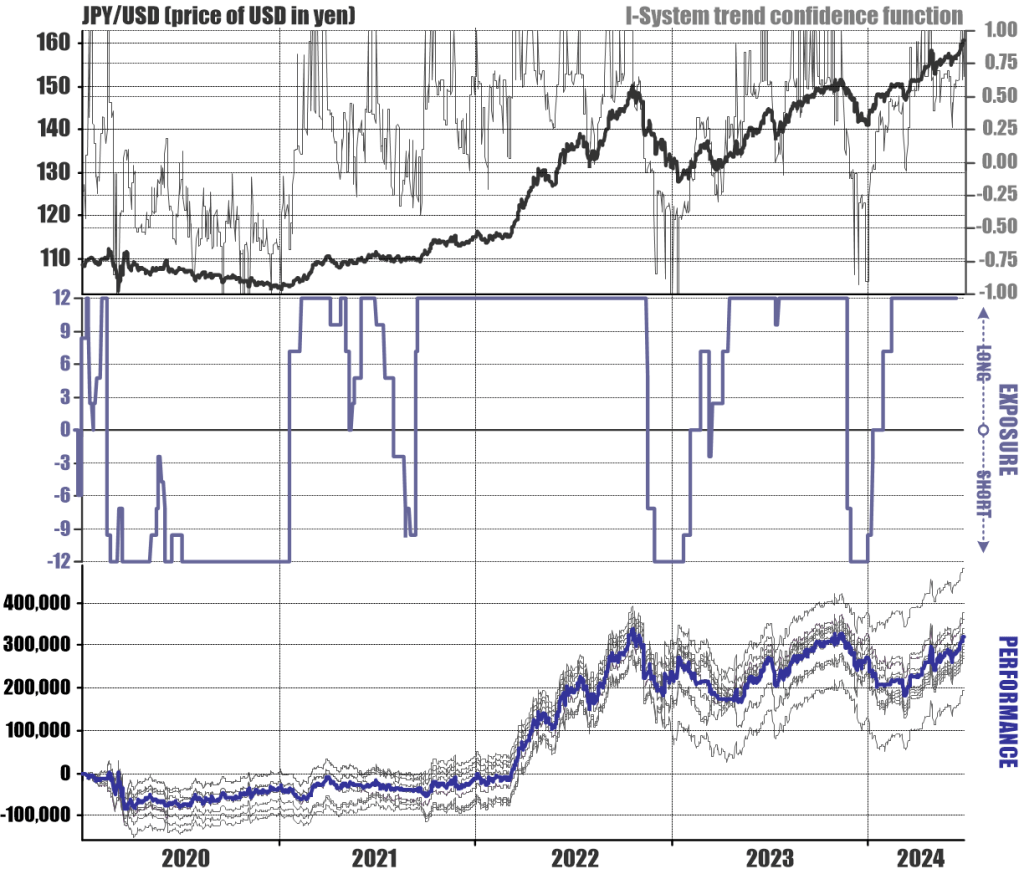
The top panel of the chart shows the price of US dollar in yen (left scale) overlaid with the I-System trend confidence function (right scale). Trend confidence fluctuates between -1 and 1, where -1 represents certainty that we’re in a downtrend and 1 represents certainty that we’re in an uptrend. The middle panel shows net exposure generated by the 12 selected strategies (at -12 we’re 100% short the US dollar against the yen; and at 12 we’re 100% long). The bottom panel shows the strategies’ performance in yen, each trading a single 5 million yen position.
A similar chart shows our performance trading CSCE Cocoa futures:
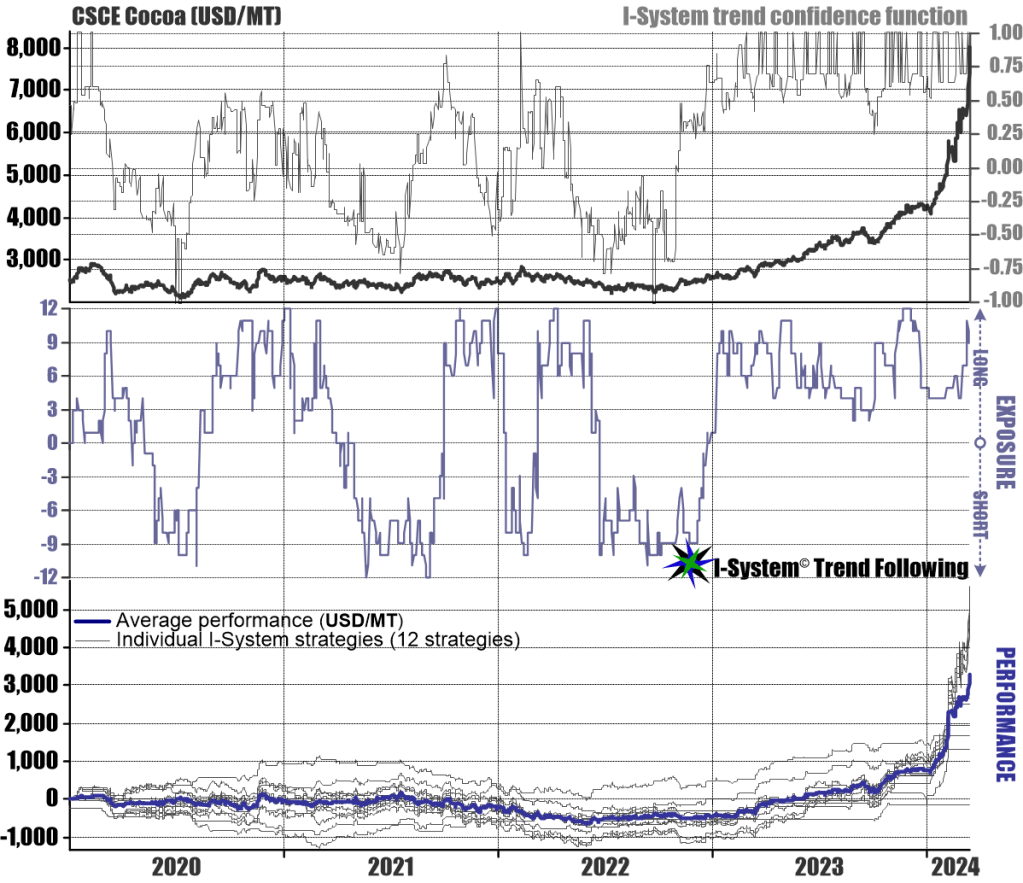
In both charts we can see the usual experience with trend following: long periods of trendless price fluctuations give way to LSPEs (large-scale price events), which tend to unfold suddenly and seemingly out of nowhere. The months and years of disciplined and patient positioning for those events usually pay off multifold. The next chart shows our performance in Brent crude oil futures from 2014 through 2022:
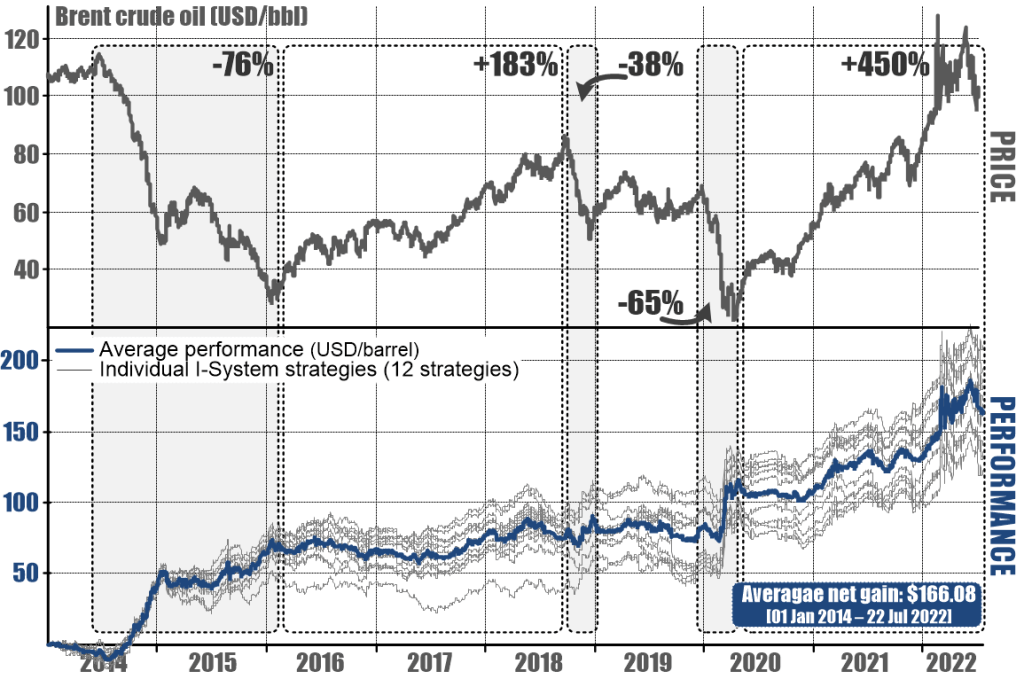
The shaded areas highlight large-scale price events (LSPEs) and also underscore one of the greatest advantages of trend following: the ability to generate profits both in bull and bear markets.
How do the I-System strategies generate signals?
Trading signals are based exclusively on an analysis of price fluctuations dynamics of individual markets in question. A more thorough answer to the above question is a bit more involved, so we provided in the following PDF document: Description of a typical I-System strategy
The explanation is valid for all I-System strategies, even though each of them differs in terms of its “genetic code” (a different combination of calculation parameters) which determines its speculative behavior. In spite of those differences, each strategy’s ultimate objective is the same.
What is the objective of I-System strategies?
The objective of each strategy is to generate windfall profits from large-scale price events (LSPEs) while limiting losses from adverse price events (corrections, trend reversals or longer periods of range-bound price consolidation). LSPEs almost invariably unfold as trends that can span weeks, months or even years. For this reason, each strategy generates buy or sell signals only a handful of times per year.
Do the signals include limit prices or target prices?
The signals do not include the “limit price” at which the trades should be executed, or a target price for any anticipated market move. While I-System does include profit taking and stop-loss signals, these are integral to each trading strategy and are only generated after the market closes, on the basis of the session’s range.
How and when should the trades be executed?
They should preferably be executed at a regular time of day during the trading session: for example, 1 hour after the market opens. The reason for this is to avoid the temptation to try and improve the results through intraday timing of trades.
For every few trades you might improve in this way, you run the risk of missing a significant price move in your favor, and in the end, intraday speculation isn’t worth the stress. Setting a fixed time for the execution of trades is a simple way to impose the discipline needed to avoid this temptation.
In fact, this is what successful trend followers do; it makes part of ‘best practices’ in trend following. What we’re after are large-scale price events. Small, intra-day price fluctuations are regarded as noise with random effect: at times they might work in our favor but at times they’ll have a negative impact. Over a large sequence of trading decisions, their impact will converge on zero.
Why do we have multiple trading strategies for each market?
Perhaps the most frequently asked question (and one where there’s been most misunderstanding) is, why do we use multiple strategies for each market? The problem with quantitative trading strategies is that we can only measure their past performance. Going forward, we cannot predict how well they’ll do: any strategy, even a top-performing one, can experience a losing streak at any period of time. By using multiple strategies and fragmenting risk among them, we significantly reduce the likelihood of disappointments and improve the likelihood of satisfactory results.
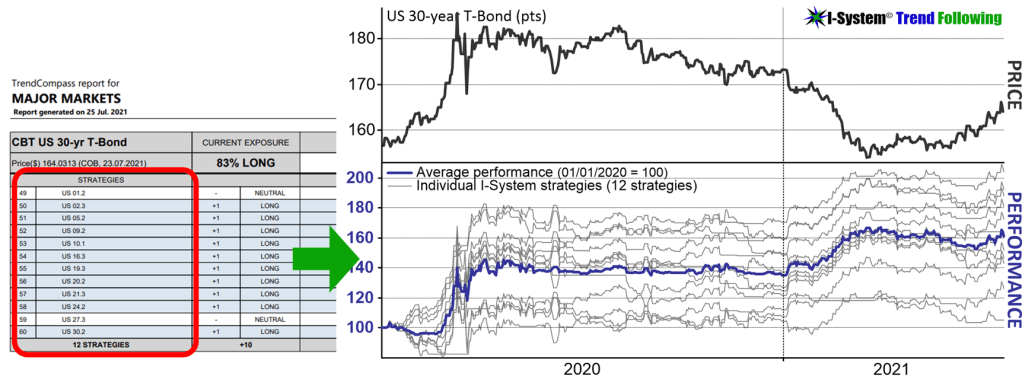
The best analogy for this approach would be as follows: suppose you set aside a $12,000 risk budget to trade the U.S. 30-year Treasury Bond. Rather than turning the whole sum over to one trader, you allocate $1,000 to 12 different traders. Instead of one trader buying and selling 12 contracts, you get 12 of them to trade 1 contract each. All the traders apply the same knowledge framework, but each one looks at the market in a slightly different way: some of them focus on short-cycle trends, others at medium- or long-cycle trends; some are content to have a position most of the time while others are quicker to take profits or cut losses and spend longer waiting for a signal to put on a new trade.
With multiple traders, you know that some of them will do well and others less so, but you can also be more confident that on average, your traders will do well and that even if one or two of them do poorly, the group is more likely to generate satisfying results over time.
Why not just use the best strategies?
We can always tell which strategies excelled in the past, but we have no way of knowing which ones might excel over the next few months or years. The following chart illustrates the point:
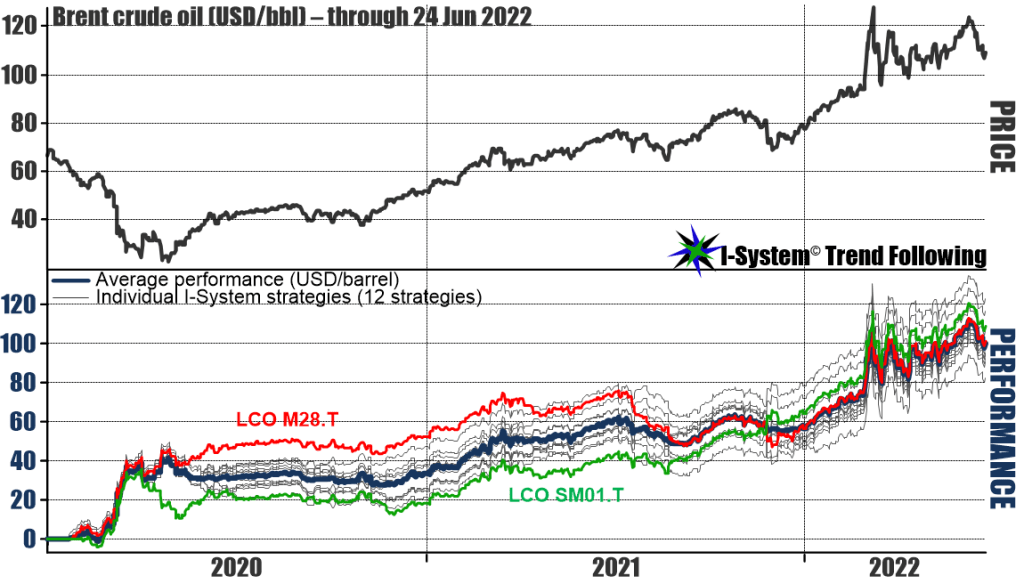
Systematic trading strategies are simply sets of rules of speculative decision making: when to go long, when to go short, when to cut losses and when to take profits. In the above example, the strategy LCO M28.T was the best performer for about 15 months through March 2021. One thing we’ve always tried to convey to traders is that they need to be careful not to unduly favor their winners, nor eliminate the laggards. As the above chart shows, LCO M28.T peaked in March 2021 and has since then fallen back on the average performance for the set. By contrast, the laggard LCO SM01.T became one of our best performers after December 2020.
Price fluctuation dynamics continuously change over time in ways that may be imperceptible, so the rules that worked during one interval may become less effective in the next one. Conversely, the rules that missed the mark in the past might have a much better run in the future. Of course, all these variations must fall within the bounds of “reasonable” speculative behavior. To make sure that all of our strategies behave reasonably, we use more than 30 years of historical data to ‘train’ them, and each strategy must show such reasonable behavior across all market conditions.
Is it not safer to trade options?
No, we strongly recommend against it. With the surge of retail brokerage platforms, trading options has become very popular. Their attraction is that they allow us to pay a fixed premium which is the maximum we can lose on a given trade. On a single-transaction basis, this is correct. But portfolio management entails a continuous sequence of transactions.
If you use options, you’ll pay the premium repeatedly in anticipation of some market move, but what if the payoff takes for too long? Those premium payments can and do add up. In fact, most options tend to expire worthless: during ordinary market conditions, at least 1/3rd of all options do; but when volatility shoots up, more than 90% of all options expire worthless. In other words, big market moves do happen but most options traders gain no benefit from them.
It is important to know that options are priced to provide the greatest advantage to the market makers who write (sell) options. It is no exaggeration to say that this advantage is similar to that of the house of gambling casinos. This is why trading options used to be illegal through much of history. Wall Street lobbying legalized options in 1870 but the FDR administration outlawed them again in 1936. They remained illegal until 1973 when the CBOT opened its options exchange. Since that time options trading has become mainstream, and their use and legitimacy is today unquestioned.
Investors should be very vigilant in trading options. As trend followers with nearly 3 decades’ experience in the industry, we are yet to encounter a successful hedge fund that bases their trading on buying options.
Which markets should I trade?
Most importantly, diversify: investors should seek as much diversification among non-correlated markets as possible and make the selection from the six main groups: equities, treasuries, FX, energy, metals and agricultural commodities.

What market instruments can I choose from?
The conventional way of gaining exposure to these markets is through futures contracts. However, these are too large for most investors as they entail trading a minimum of 1000 barrels of crude oil, 5,000 bushels of Corn, 100 troy ounces of Gold, etc.
Thankfully, today we have a variety of other options. I-System strategies can equally be applied to futures mini-contracts, appropriate ETFs (exchange-traded funds), or to CFD contracts (cash for differences) offered by many online brokers. CFDs allow traders to gain exposure to commodities and other financial instruments in much smaller lots (i.e. a single ounce of Gold, 10 barrels of crude oil, etc.).
Caution with using leverage
It is extremely important to understand that leverage increases risk: it’s mostly to the downside! The more leveraged your bets, the more you can profit from a trade. After all, making a profit is the only reason why we trade in the first place. This is true even if the trade is a hedge: the original trade’s objective was profit and the hedge’s objective is to limit the downside. With online brokerage accounts, particularly with CFD contracts (cash for differences), it is easy to leverage your exposure 50- or even 100-fold, which is how most people get into trouble.
To generate profits we must take risks; that much is clear. But how much risk we should take is not obvious. Our inner gambler always wants to press on the gas pedal to profit more, especially when we are trying to climb back up from a drawdown. But like with fast cars or motorcycles, the harder we press the accelerator, the more likely we are to get hurt. Investment trading is a psychological challenge and excessive risk taking has a robust tendency to compound errors.
Research from FXCM brokerage offered empirical evidence of this. Namely, FXCM noticed that the higher the leverage their clients used, the lower the proportion of their profitable trades:
Leverage Percentage of profitable trades
<5:1 40
5:1 – 10:1 29
10:1 – 25:1 22
>25:1 17
What could be the explanation? If a trade goes against you and you are highly leveraged you have much less of a loss-absorbing cushioning, which may force you to exit trades with a loss sooner. In the short term, market price fluctuations are close to random. This implies that your trade is equally likely to be profitable as it is to slip into the red in the short term. If your risk management is sound, you should be able to tolerate temporary drawdowns and keep your positions until they turn profitable. But if you are too aggressive, you might have to cut good trades at the exact worst moment. If this happens repeatedly, your positive trades might not suffice to restore you to profitability.
I believe that even 5:1 in the above table is too much leverage. Leading CTA hedge funds who should rightfully be regarded as a standard in robust risk management seldom exceed 3:1 and tend to content themselves with [1.5-2.5] : 1. Again, portfolio management is a marathon, not a sprint: keep in the slow lane and be light on the gas pedal.
How should I size my bets?
Determining your position limits is the foundation of your risk management. Position limits define the maximum size of your exposure in each market you trade. This limit should not be exceeded. To determine position limits, we prefer to use Value-at-Risk (VaR). VaR tells us how much money we risk to lose (or gain) per contract or share of some security. For example, you risk losing around $4 in holding a single barrel of oil during a 5-day period (this value varies over time).
More technically, we look at the 5-day, 99%-confidence VaR. It isolates the largest 1% of 5-day price swings. That may sound like mumbo-jumbo, but it’s not rocket science:
- 5-day, 99%-confidence VaR isolates the largest 1% of 5-day price swings
- 3-day, 99%-confidence VaR isolates the largest 1% of 3-day price swings
- 3-day, 95%-confidence VaR isolates the largest 5% of 3-day price swings, and so on.
The result of whatever VaR calculation we use, is a number of dollars (or yen, or euros…): the price change we could expect if a bad 3- or 5-day period hits the market in question. It will be different for crude oil, silver, coffee, USD/JPY or the US 2-year Treasury Note as each market has different price fluctuation dynamics, which is what drives our investment risk. In any 3-day period, the 2-year T-Note will barely move, while the price of Brent crude oil, silver of coffee could move 5% or more. Thus, $100,000 worth of Brent crude oil or coffee could be equally risky as $1 million’s worth of 2-year T-Note (this is just for illustration, not exact figures). It is essential to take this into account and do your homework when deciding your position limits.
Either way, when we multiply that VaR figure per so many barrels of oil, ounces of silver or pounds of coffee, we get a fair estimate of how much we stand to lose or gain from such exposure over the next 3 or 5 days (or whatever parameter we choose).
Going for equal risk weighting
You may have your views about which market is next to explode higher or collapse and you may feel tempted to overweight your exposure to that market. We strongly recommend against this. At times you’ll be right, but if you’re not, too much risk in one market could produce outsize losses.
Best practices in trend following suggest maintaining equal risk weighting so that we run similar-sized risk exposure in each market. It is essential to keep in mind that the source of your risk exposure are the price changes in each market. For that reason, risk weighting must reflect the Value-at-Risk calculations and not the absolute value of the underlying securities we buy or sell.
To help you make the VaR calculation, you can download and use the simple worksheet provided below:
How aggressive should I be?
Not very aggressive: shoot between 15%-20% returns per annum.
Over the last three decades, we’ve devoted a good deal of effort to researching the performance of active investment managers and found that while there are some outliers, over the long term the best among the best tend to perform in the mid to high teens: around 16-17% after fees. This implies that before fees, the speed limit should be in the low 20s.
The outliers may go higher, but almost invariably, such outperformance (like Peter Lynch) either overlap major boom cycles, or like Warren Buffett, involves the momentum strategy (a different name for trend following). Investors who know about the legend of Jim Simons’ Medallion Fund may object, but they shouldn’t. We have a lot of questions about this particular legend and don’t quite buy it (see at the link).
Trading futures, mini-futures or CFDs offers investors free leverage and enables them to trade much larger positions than would otherwise be possible. Many inexperienced traders see their account value swing 5% or 10% in a single day, so they may believe that attaining 100% returns/year is within reach. This is a dangerous pitfall. Again, it’s like driving a car: the faster you go, the more likely you are to get hurt.
We strongly recommend keeping your leverage well below 3x and driving in the slow lane: managing your portfolio is about achieving life-long success, not about scoring a blow-out month or year. From that perspective, achieving 15%-20% annual returns is brilliant! Sustaining your average returns in that range over time can become life changing, even if you begin with a modest portfolio.
For more, please check also the seven simple DOs and DONTs of trend following at the link!
Other questions?
We hope that the above “User Manual” is helpful but if we forgot to cover something important, please never hesitate to ask: simply, drop us a question to TrendCompass@ISystem-TF.com. Remember: there are no dumb questions – the questions that may seem so are usually the most important ones to answer in the clearest possible way. We’re always up for that challenge.
Further resources
A more extensive elaboration of trend following, the philosophical and technological basis underlying I-System Trend Following can be found in Alex Krainer’s book, “Mastering Uncertainty in Commodities Trading,” which was rated #1 on FinancialExpert.co.uk list of “The 5 Best Commodities Books for Investors And Traders” for 2021 and 2022. You can download a PDF copy at this link.
His more recent title, “Alex Krainer’s Trend Following Bible” is also available for download at this link. If you’ll choose one of the two books to read, we’d recommend the Trend Following Bible: even though it hasn’t won any awards (thanks in large part also to Amazon’s cancellation of the author), it is perhaps a better, easier to read, and more recent text.
You can also find Alex’s interview discussing trend following with Michael Covel on TrendFollowing.com at this link:
Episode 975: Alex Krainer Interview with Michael Covel on Trend Following Radio

