Technical Analysis, deemed as voodoo superstition by many – perhaps most – investment professionals, can be extremely useful to traders, not so much as means of prediction as means to identify trades with positive risk-to-reward attributes. In the past, I identified valid trading signals for Bitcoin, based entirely on TA:
- 14 May 2021: “Bitcoin reversal? Three technical warning signs!” – while bitcoin was still trading above $50k TA patterns indicated the risk of a sharp correction. Over the next 6 weeks, bitcoin dropped below $30k.
- 14 July 2021: “Bitcoin: a buy at $32,000?” – in the aftermath of that correction, TA suggested a possible bullish reversal and a good risk-to-reward trade. I suggested it could rally to $50k, which it did by early September 2021.
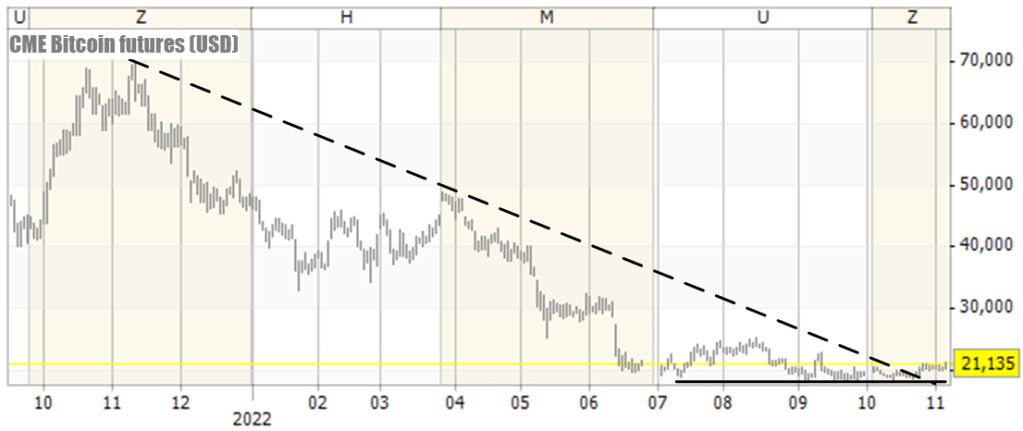
I think it should be clear that there was hardly any valid fundamentals-based analysis to suggest these trades. Only TA provided some valid navigation guide posts. Today Bitcoin offers another good tactical trade, as the following chart shows:
The analysis
In the above chart, we can see that the October price action broke the 12-month trend line as Bitcoin feebly bounced off of the support area above $19k. During this time Bitcoin dipped below $19k a few times during September and October, setting an intra-day low at $18,005 on 13 October. The next trade is based on three elements: (1) confirmation of the support area, (2) breaking of the trend-line, and (3) trending higher since mid-September. From here, bitcoin may be poised for a more significant rally over the coming weeks.
It’s not about making predictions
The trade is not be about getting the prediction right. Rather, it’s about considering and planning a tactical long trade from the present levels. A rally, if it takes off, could easily reach the next resistance level at about $30k or even $40k – $50k. On the down-side, we can guess that the present support level will hold, at least temporarily, and set our stops just below $18k. As I write these lines (Monday, 7 Nov. 2022 at 14:40 GMT), Bitcoin is trading at $20,746. The resulting trade would have roughly $10k to $30k up-side and less than $3k to the down-side.
With regards to the above chart, another few observations are in order: again we see that markets move in trends. Nobody could have predicted last year’s top for bitcoin, the duration or magnitude of the subsequent correction. But that correction did play out as a trend, spanning a full year. With effective, high-conviction trend following strategies you did not need to predict bitcoin’s trajectory. What you needed was patience, discipline and judicious risk-management (i.e. not getting in over your head).
If you consider making discretionary trades (rather than strictly following systematic signals), you must be prepared to always stick with the plan: if you set your stop-loss at $17,995 and the price of bitcoin drops below that level, be sure to take that loss and exit the trade. A drop below the stop-loss level would reconfirm the downtrend, and possibly many more months of decline. It is always better to keep your powder dry for another shot when an opportunity presents itself. Unfortunately, most traders are inclined to “average down” as the purchase price of a security declines. This is why 4 out of 5 active traders lose money – it’s an empirical fact. Check the brokerage advertisement below: it says that 83.45% of retail investors lose money!
Keep it simple!
Technical analysis should be simple. Many analysts unduly complicate things, I don’t quite know why – perhaps it is to impress their clients or their employers. This is probably a sad waste of talent:

I’ve used TA for over 25 years now, and I can say that this is not the way to do it – in fact, I suspect that the above charts illustrate the kind of analysis that makes TA seem like voodoo superstition. Even if these attempts were in earnest, they are are probably futile; however much analysis you throw against any price chart, you won’t be able to predict its future trajectory.
What TA should yield are identifiable trades where you can take directional exposure, hopefully time your trade a bit better than random, and plan your loss if you’re wrong. While it’s true that there’s an implicit prediction in every trade idea, you should always assume that there’s a 50% chance that the prediction is wrong . What you’re after is a positive risk-to-reward proposition and some clear guide posts around which to manage your risk. That’s all.
Alex Krainer – @NakedHedgie is the creator of I-System Trend Following and publisher of daily TrendCompass reports, covering over 200 key financial and commodity markets for investors and traders – probably the best CTA daily newsletter on the market today. One month’s test drive is always free of charge – no strings attached!


Hello Alex,
Thanks for all the article you post on trading and geopolitics (naked hedgie), it’s always very interesting.
I have been a fundamental analyst all my life. I am a newbie on TA stuff and yes you’re right everybody in the investing business consider it voodoo
Do you think John Murphy’s book is still relevant to study TA ? Are there any another good book you can recommend or article/search studies you’ve used maybe ?
Thank you.
LikeLike
Hi M, I would definitely recommend Murphy’s book. If you’ve been a fundamentals analyst all your life, you might have to hold your nose and read with an open mind, but i assure you, as you look at price charts you’ll encounter what Murphy describes again and again and again. From there, I think you don’t need to read many books – it’s really about judgment heuristics and you’ll probably advance more from analyzing charts than from reading books. I also have one title, “Alex Krainer’s Trend Following Bible” which is available as a free download (not free because it’s rubbish but because Amazon cancelled me, then continued selling my books at huge prices). You’ll find a copy here: https://isystem-tf.com/about/
LikeLike