If you trade, trend following could prove your protector guardian through the coming market turbulence – do not fly blind. Over the past 10 weeks I-System trend following strategies generated $50 per barrel in profits from the oil price rise – $50,000 per Brent futures contract. Here’s how.
Following trends vs. trading the news
Over the past 25 years I have seen time and again how the temptation to profit from “obvious” trades often leaves inexperienced traders with bruising losses. Wednesday, 23 February was the perfect example of this. On that day, Vladimir Putin ordered Russian invasion of Ukraine. This was obviously going to push oil prices higher: the May 2022 Brent futures contract opened at $95.37 per barrel, but it quickly jumped close to the day’s high at $102.65. But there it stalled and proceeded to drift lower for the rest of the day. By the end of the session, the price closed at $95.42, up only $0.18 for the day.
Anyone who jumped in for some quick profits most likely ended up disappointed. Profiting from news events is in fact difficult and unlikely. Some events do have broadly predictable impact on prices, but by the time you heard the news, so did everyone else and that news event could already be in the price. Stressing about the news flow and maneuvering to catch the day’s moves is probably not worth your trouble.
LSPEs
The real opportunity for traders lies in the large-scale price events (LSPEs) that invariably span weeks, months or even years. LSPEs are demonstrably the most powerful drivers of investment performance (I presented the empirical evidence in this 10-min video presentation) and almost without exception, they unfold as trends. Using well formulated, high-conviction trend following strategies is the most effective and most reliable way to capture value from LSPEs.
Recent Ukraine events and market reactions to them are yet another case in point. In the chart below, I’ve summarized the way our 12 I-System trend following strategies for Brent Crude Oil futures navigated these events. These strategies are included in our Major Markets portfolio and what is conveyed in the chart below is not a backtest simulation but the real effect of trading signals as communicated to TrendCompass subscribers through Friday, 4 March 2022:
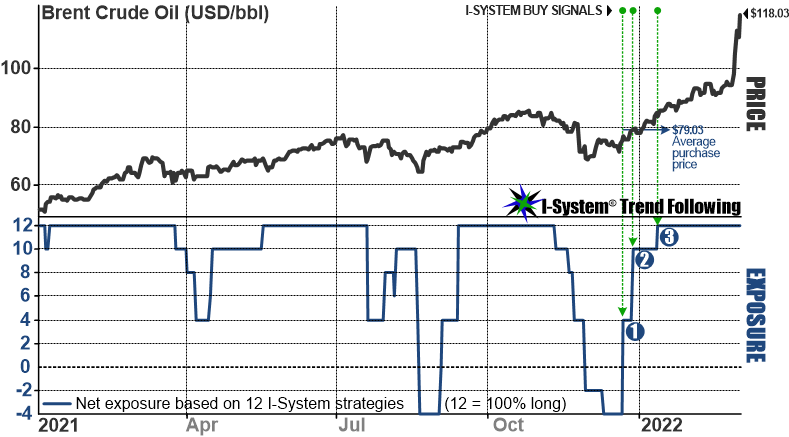
The portfolio went net long already on 24 December, added long exposure five days later and was 100% long by 13 January 2022:
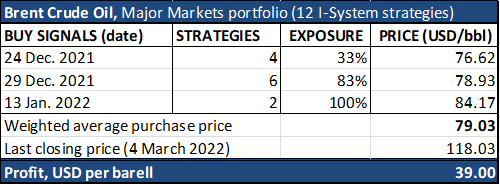
Weighted average purchase price for these trades was $79.03/bbl and in ten weeks’ time they generated a profit of $39/bbl or $39,000 per Brent futures contract. Add $11+ as of Monday’s market opening price and we’re past $50,000 per contract. This would be next to impossible to achieve by short-term maneuvering around news events. You had to take your positions ahead of the events and let your profits run from there. This is easier said than done, of course, but it can be done with high quality trend following strategies.
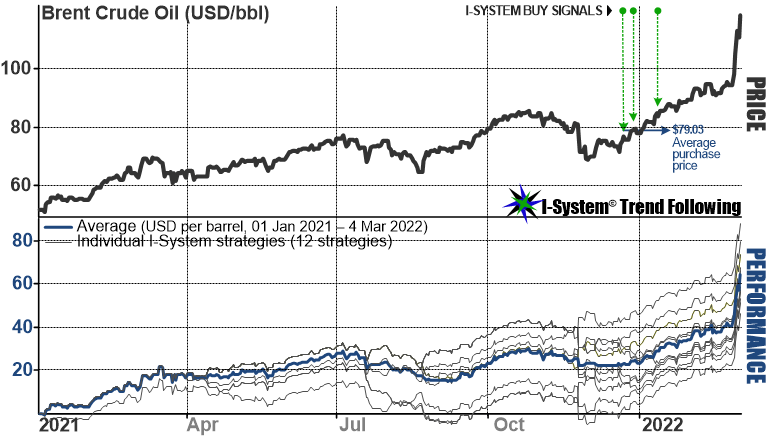
The chart below shows the performance of this same set of strategies from the beginning of 2021:
What’s the deal with multiple strategies?
The most frequently asked question (and one where there’s been most misunderstanding) is, why do we use multiple strategies per each market instrument? The problem with quantitative trading strategies is that we can only measure their past performance. Going forward, any strategy, even a top-performing one, can experience a losing streak at any period of time. By using multiple strategies and fragmenting risk among them, we significantly reduce the likelihood of disappointments and improve the likelihood of satisfactory results.

The best metaphor for this approach would be as follows: suppose you set aside a $120,000 risk budget to trade the 30-year T-Bond. Rather than turning it over to one trader, you allocate $10,000 to 12 different traders. Instead of one trader buying and selling 12 contracts, you get 12 of them trading 1 contract each. They all use a similar approach, but each looks at the market in a slightly different way: some focus on short-cycle trends, others at medium- or long-cycle trends; some are content to have a position most of the time, others are quicker to take profits or cut their losses and wait longer for the right signals to re-enter. In the end, you know that some of your traders will have done very well and others much less so, but you can also be more confident in your expectation that on average, your 12 traders will do well and that even if one or two of them underperform, that your investment will generate satisfying results. This could be very important for your confidence and peace of mind which will make it much easier to maintain your discipline – perhaps the most important determining factor of your long-term prospects as an investor.
Navigating with confidence and peace of mind
Even if you feel comfortable in your ability to read the markets and trade at your own discretion, things can go wrong. During similarly momentous geopolitical developments nearly 20 years ago, I had the unhappy privilege of experiencing this first hand with my boss as the drama’s protagonist. As a veteran with more than 20 years of experience managing an independent commodity trading business, he fit that “smartest man in the room” stereotype and was undeniably a successful oil trader.
But so was every single perpetrator of hundreds of rogue trader scandals in history. They were all masters of the universe who at some point got trampled by the markets. My bosses turn was in early 2003. As the United States seemed poised to invade Iraq[1], he judged that the crisis was already ‘priced in’ and that the invasion itself would trigger a major correction. Confident in his judgment, in mid-January 2003 he started taking short positions in IPE Gas Oil futures. The experience struck me as a significant lesson in trading psychology and risk management and I made a detailed record of it. The above chart is only a visual summary of the experience. The experience struck me as a significant lesson in trading psychology and risk management and I made a detailed record of it. The chart below is a visual summary of the experience.
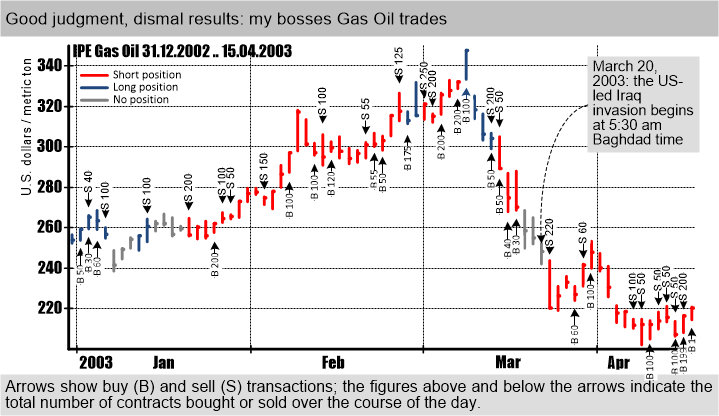
Unfortunately for him, the price of Gas Oil kept rising through January and February. As losses accumulated, he started second-guessing his judgment and trying to recover the losses, his trading became increasingly frequent and erratic. Over a 14-week period he made 46 different transactions, most of them reacting to day’s events, price averaging and guessing about the next few days’ or hours’ price moves, all of which only made things worse. Note how his trade sizes increases as losses mounted – this is a typical rogue trader incident in the making. Traders facing large losses often gamble more and more aggressively to make themselves whole. Ultimately, his judgment proved correct: from its March 2003 highs, the price of Gas Oil dropped by 39%. In spite of that, his trading produced a huge loss that actually blemished his reputation.
Why not give trend following a chance?
At that time I had already built the prototype of the I-System and I strongly advocated systematic trend following as a way to navigate markets. But my boss dismissed the idea. He said that he’s been trading successfully for over 20 years and he wouldn’t have some stupid computer program tell him how to do it. In fact, I think that his debacle with trading the 2003 Iraq invasion was in part the result of him showing me how it’s done, which reminds me to point out that if you trade, you must always guard against letting ego and pride affect your judgment. Trend following can help with that challenge too.
Uncertainty
But the thing with trends is that they are unpredictable. Nobody can really tell when they’ll take off, how high (or low) they could go or how long they’ll go on for. Take the example of Lumber prices. For most of the last three decades, lumber prices ranged between $200 and $400 per 1,000 board ft. Then in 2016 they started to trend, reaching $600 in 2018 and vaulted past $1,600 by 2020. That certainly qualified as a LSPE. But even if you somehow predicted that, profiting from it would have been a different matter. As we can see, the price trajectory wasn’t exactly a straight line:

Simply buying a few contracts of lumber futures and passively enjoying the windfall wasn’t an option. But a quality trend following strategy would have done the trick through all the big rallies, and also through major corrections. Last September (2021), I formulated three trend following strategies for Lumber futures. Normally, this would be a time consuming project (give or take 20 hours of work), but here I only used one of the I-System’s 13 algorithms, the TMA or “Two Moving Averages” with all other algorithms inactive:
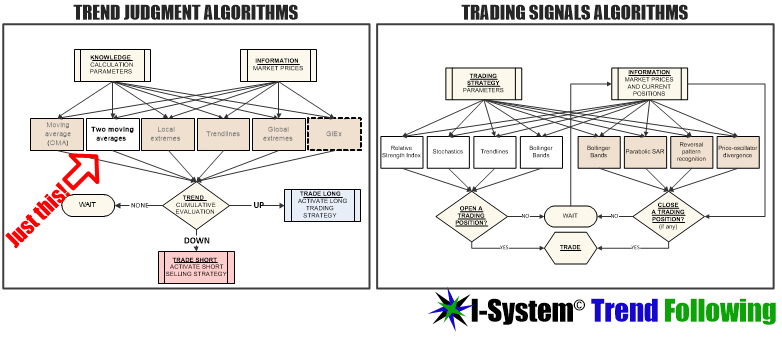
On that basis I then selected one long-, one medium-, and one short-cycle trend strategy and left the project at that as I don’t trade lumber futures. A few weeks ago I went back to see how the strategies had performed over the ensuing seven months. The results are summarized below (screenshot from I-System):
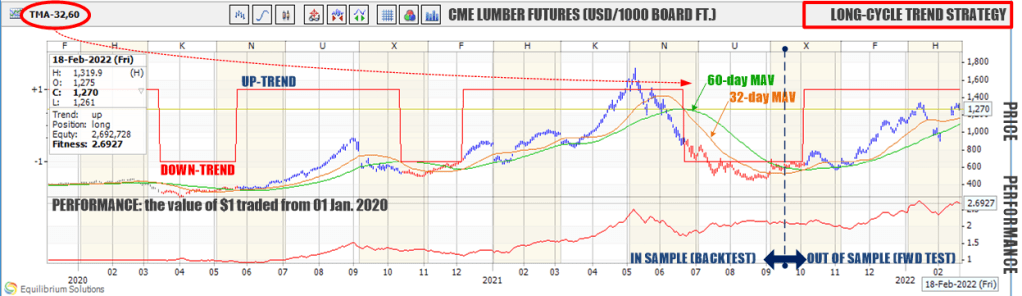
The long-cycle strategy uses 60-day and 32-day moving averages. The blue price bars indicate long exposure to lumber price, red bars indicates short exposure.

Medium-cycle trends are based on 24-day and 8-day moving averages and the short-cycle trends use 7-day and 8-day moving averages:
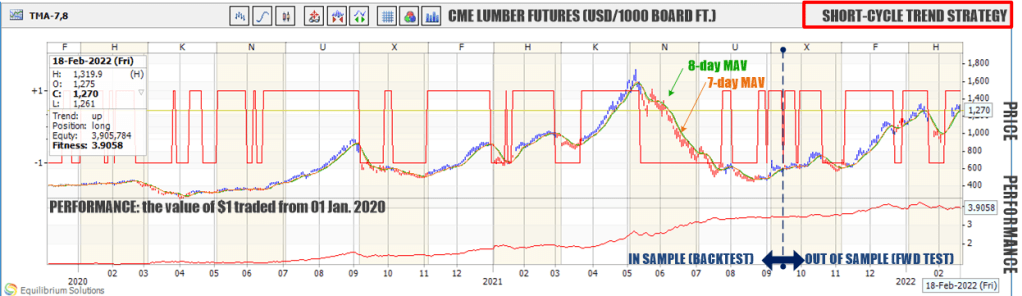
In the above sample, it would appear that the short-cycle trend strategy is the best performer and the long-cycle strategy the worst. But it would be premature to draw that conclusion after only a seven month forward test. In fact, based on the experience of running literally millions of similar simulations over the last 20 years, I can say categorically that in most markets by far, long-cycle strategies tend to be the most reliable performers.
In systematic trend following reliability is more important than absolute performance. In general what we want to do is formulate a set of strategies that will show reliable performance over long time intervals. That means that they must catch large-scale price events with no exceptions, and that their losses through adverse market conditions (corrections, reversals and trend-less periods) must be acceptable. That would be true about the 12 Brent strategies we just saw.
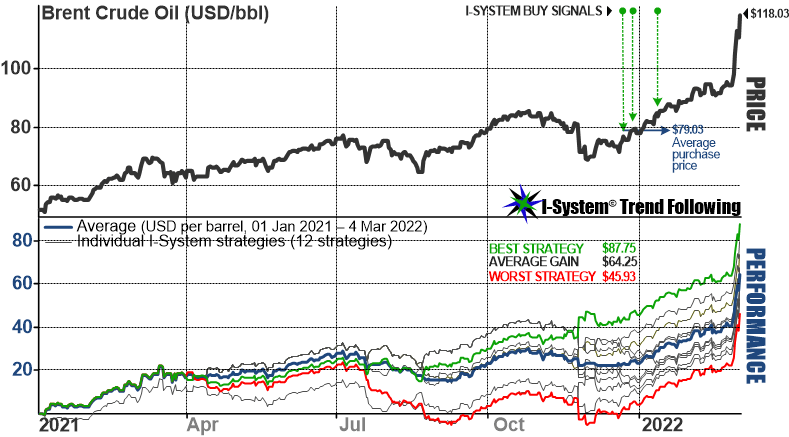
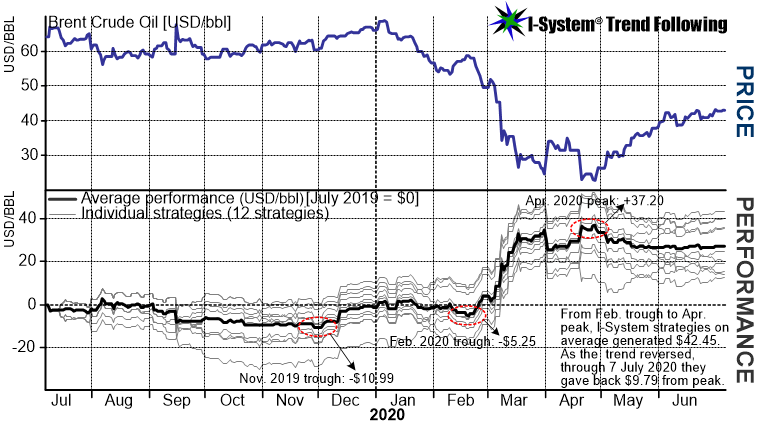
The result is that even the least effective strategy performed relatively well, catching nearly $46 windfall per barrel over the last 14 months. Our best strategy did almost twice as well, generating a profit of $87.75/bbl. The trouble is, we can never tell in advance which strategy will prove the best. By using a diverse set of them, we attain that critical challenge of high conviction investing that makes it possible to navigate profitably, with confidence and peace of mind. This is not just something nice to say – it is in fact critical to your success as a trader because without confidence and peace of mind it is next to impossible to keep the discipline which is perhaps the most important determinant of your performance, and an essential prerequisite to navigating through the turbulent market environment that lies ahead. For those who followed I-System TrendCompass, they’ve been long crude oil since last Deember, long Copper and Gold futures, long grains like Wheat and Soybeans, short the Treasuries and Bitcoin as well as the Dax and Nikkei, etc.. In short, they’ve been on the right side of every LSPE for the last 19 years. For example, here’s how the same 12 Brent strategies above navigated the 2020 price collapse:
These results did not necessitate any kind of analysis or accurate prediction other than a disciplined adherence to a set of high-conviction trend following strategies. If you do not already use such strategies, please do not fly blind through the coming market turbulence. Consider signing up for our daily TrendCompass newsletter by simply e-mailing us your request at TrendCompass@ISystem-TF.com. You’ll begin receiving your reports the very next trading day.
Sign up for a 1-month free trial of I-System TrendCompass!
One of the best trend following newsletters on the market, I-System TrendCompass delivers consistent, dependable and effective decision support daily, based on I-System trend following strategies covering over 200 key financial and commodities markets with no dilution in quality or focus.
- Cut the information overload
- Get real-time CTA intelligence in seconds per day
- Never miss a major trend move
- Navigate trends profitably, with confidence and peace of mind
One month test-drive is always on us. Sign up for a 1-month FREE trial by e-mailing us at TrendCompass@ISystem-TF.com
To learn more, please visit I-System TrendCompass page.
Notes:
[1] At the time, the Amercan invasion of Iraq was by no means a foregone conclusion and most of the media treated this as the last resort, worst-case scenario outcome that might yet be avoided, so the conflict’s consequences for the oil market were far from clear.
