
At the end of December 2022, we’ve tracked the Major Markets portfolio for full three years and over that time it has performed very well, entirely fulfilling its objective of generating positive returns, uncorrelated with traditional asset classes. This document offers a visual performance summary of the portfolio and of the 190 I-System strategies that comprise it.
FULL MAJOR MARKETS PORTFOLIO
For the purpose of this analysis we allocated $100,000 risk budget to each one of the 180 strategies comprising the Major Markets portfolio (excluding Bitcoin). Position sizes were set in a way that one standard deviation of daily P&L (profit & loss) changes corresponds to 20% of the risk budget, i.e. $20,000, resulting in a very moderate risk profile. The portfolio’s performance (after commissions) through December 2022 is illustrated below.
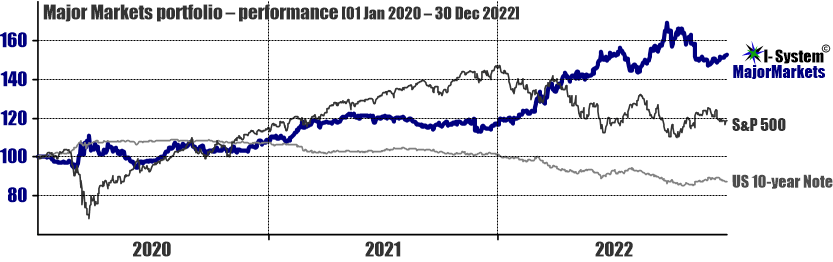
Both the Major Markets portfolio and the S&P 500 sustained their largest draw-down in 2020, in the aftermath of the March/April 2020 collapse. With regards to the Major Markets portfolio, given that the 14.66% drawdown is based on daily data, this was a very moderate decline (investment funds normally report draw-downs on the monthly basis, which partially obscures the worst draw-downs that would be visible in daily data).
After three years, monthly statistics for Major Markets portfolio compare favorably to S&P 500:

Keeping approximately the same risk exposure in all of the above 15 markets have generated the following performance (after all the commissions on trades and roll-overs)
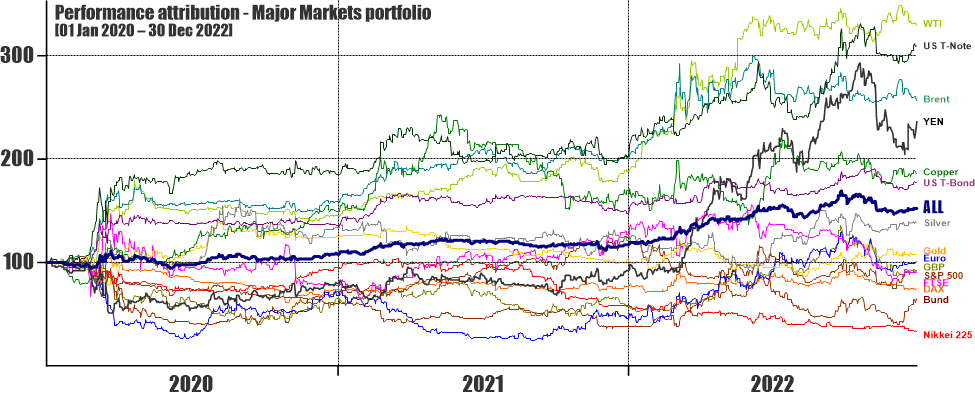
Thus far, bulk of the gains came from exposure to energy and US Treasury markets. This year currencies (EUR, GBP, YEN) have also been strongly profitable. Of course, we never predicted any of this. But the beauty of trend following is that we never needed to.
Each curve in the above chart represents the average performance of the 12 individual trading strategies assigned to each of the 15 markets. The section below provides a visual performance summary for these strategies in each market.
PART 1: CURRENCY PAIRS
Having lost ground in 2020, US dollar returned to strength in 2021 and in 2022 when a stronger trend emerged. This enabled our strategies to generate substantial gains, particularly against the hardest hit Japanese yen. The correction in Q4 2022 resulted in a substantial drawdown through the end of the year.


Among the 12 strategies under USD/GBP, one is a clear outlier on the positive side. This observation almost invariably raises the question, why not just use that strategy, since it’s been the top performer? The problem is that we have no way of knowing which strategy will be the top performer in the future. Over the past 20 years we’ve seen time and again that even the best strategies can experience a losing streak and lose ground; we’ve also seen that laggards can pick up and become among our best strategies. There is simply no way to know this in advance. Rather than guessing, the best approach is to fragment the trading risk among multiple strategies of similar quality. Their cumulative result tends to be far more reliable over the long term.
PART 2: TREASURIES


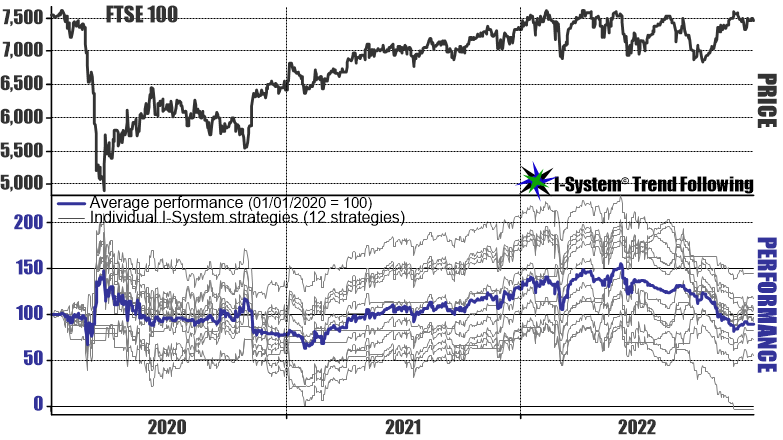
PART 3: EQUITY INDICES


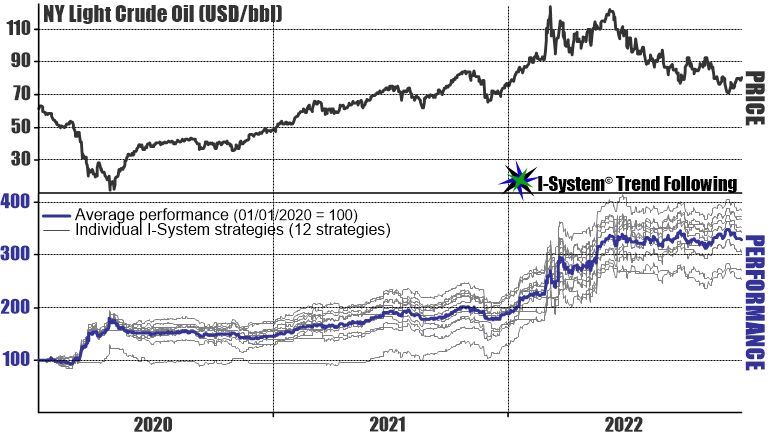
PART 4: ENERGY

PART 5: METALS


On position sizing and its effect on performance in individual markets
Risk weighting is based on short-term price fluctuations: in more volatile markets we trade smaller position sizes and vice versa. For this reason, the U.S. 10-year T-Note (TY) turned out to be among our best performers: since it is less volatile than the 30-year Bond, TY exposure is proportionally larger. But as longer-term price changes were similar in both markets, TY generated greater profits. The issue is that we can easily measure the volatility of short-term price fluctuations which determine our position size, but we can’t predict the magnitude of large-scale price events which ultimately determine the performance of our strategies.
PART 7: BITCOIN
I’ve decided to report Bitcoin performance separately from the other markets due to the extreme volatility and price appreciation over the recent months. The chart below assumes about 5:1 inverse leverage (from the initial price of $7,000) to get the volatility of returns to a similar level with other markets.

To a trend follower’s eye, Bitcoin strategies have done reasonably well; we have two outliers on the positive side, one on the negative side while six strategies traded broadly around the average. For an immature market with only 10 years of price history, this is not too bad.
When I added Bitcoin to the portfolio in May 2021 I wrote that, “The difficulty is that Bitcoin’s history consists of a series of hockey-stick rallies and long periods of sideways consolidation in between. This makes it very difficult to formulate high conviction strategies…” but that using a set of trend following strategies would probably still prove better than discretionary trading of this roller-coaster.
Namely, the extremely volatile fluctuations in Bitcoin have periodically led to mass liquidations of hundreds of thousands of accounts of bitcoin traders who found themselves on the wrong side of large price moves. I believe that Bitcoin has only begun to mature as a market and that it has transcended the hockey-stick-then-drawdown sequence only in 2021. This will ultimately make Bitcoin more suitable for systematic trend following, but it will also douse the excitement of many traders looking for quick ten-fold returns. After 2021, Bitcoin will likely lose that ten-bagger allure and remain just another thing that fluctuates and periodically trends.
CONCLUDING REMARKS
After three years with an unchanged set of 180 strategies (+10 for Bitcoin), Major Markets portfolio has done exactly what it was intended to do: catch windfalls from LSPEs (large-scale price events) while keeping the losses during trendless periods acceptable.
Consistent with our experience, we encountered a mix of significant market trends and also unfavorable periods of corrections and sideways price drift. By capturing large windfalls from trends and limiting the losses in adverse conditions, the portfolio has generated a very respectable compound gross rate of returns of 15.11% in spite of a very moderate risk profile.
The last year’s results (2022) have once more demonstrated another important advantage of systematic trend following: its ability to generate uncorrelated returns exactly when investors need it the most.
In 2023, we can expect more turbulence in the market and the risk factors include recession, inflation, the highly anticipated commodity super-cycle and unpredictable geopolitical developments. In this environment, high quality decision support could make the critical difference between the risk of painful losses and the reassurance of navigating these events profitably. If you haven’t done so already, we invite you cordially to subscribe to TrendCompass reports without delay. The first month is always free of charge, with no strings of any kind attached.
Sign up for a 1-month free trial of I-System TrendCompass!
One of the best trend following newsletters on the market, I-System TrendCompass delivers consistent, dependable and effective decision support daily, based on I-System trend following strategies covering over 200 key financial and commodities markets with no dilution in quality or focus.
- Cut the information overload
- Get real-time CTA intelligence in seconds per day
- Never miss a major trend move
- Navigate trends profitably, with confidence and peace of mind
One month test-drive is always on us. Sign up for a 1-month FREE trial by e-mailing us at TrendCompass@ISystem-TF.com
To learn more, please visit I-System TrendCompass page.

