As tropical storm Elsa powers toward Florida, a new hurricane season is upon us. Hurricanes are one of the starkest cases of nature’s elements having a direct impact on financial and commodities markets. If a storm hits the coastal regions of Texas and Louisiana in the Gulf of Mexico with sufficient strength, it can cause serious disruptions to oil production and logistics. In the process, it may push oil prices higher, which is the reason why oil traders tend to pay close attention to the weather patterns in the Atlantic Ocean during the hurricane season and keep current with the most recent forecasts.
But there’s another reason why this should be of relevance for traders, hedgers and investors: tropical storms and hurricanes vividly expose the limitations of science and technology at understanding and forecasting the behaviour of complex systems. Hurricane forecasts have greatly improved over the last few decades and the 24 and 48 hour forecasts of their trajectories tend to be fairly good. Good however isn’t the same as accurate. Furthermore, our ability to predict a hurricane’s intensity isn’t even good. Scientists’ ability to predict a hurricane’s trajectory has improved thanks to our greatly enhanced understanding of how hurricanes form and why they move the way they do.
How hurricanes form
Here’s a condensed account of what we do know about hurricanes. They likely originate from the low and mid-level atmospheric winds blowing from the east across the Ethiopian highlands. As they blow over these high mountains, they form vortices that drift westward. When they reach the Atlantic Ocean, moist monsoon winds from the Gulf of Guinea inject humidity into the vortices. If enough humidity meets a sufficiently strong vortex, masses of clouds begin forming rapidly.
Out of the total of around a hundred such easterly waves, twenty to thirty will move each season across the Atlantic with the potential to turn into tropical depressions given the right conditions – primarily high humidity and heat. As water temperatures off the west coast of Africa warm to their late-summer peak, moist air begins to rise high into the atmosphere adding more energy to the system and providing humidity for continued cloud formation.
For a large storm to form, the following ingredients are required: the ocean’s surface temperature must rise above 26 degrees Celsius; the pool of warm water must span at least a few hundred square miles and be at least 60 meters deep; a large layer of warm, very humid air must also be present, extending from the ocean’s surface to an altitude of some 5,500 meters. In such conditions, normally in place from June until December and peaking from August through October, the atmospheric disturbances caused by the easterly waves can trigger the formation of large storms.
One element however, must be absent for a hurricane to form: winds in the atmosphere over the large pool of warm ocean must be mild or consistent from the ocean surface to an altitude of at least 12,000 meters because strong and varied winds tend to tear cyclones apart. This is the key reason why hurricanes don’t form in the southern Atlantic.
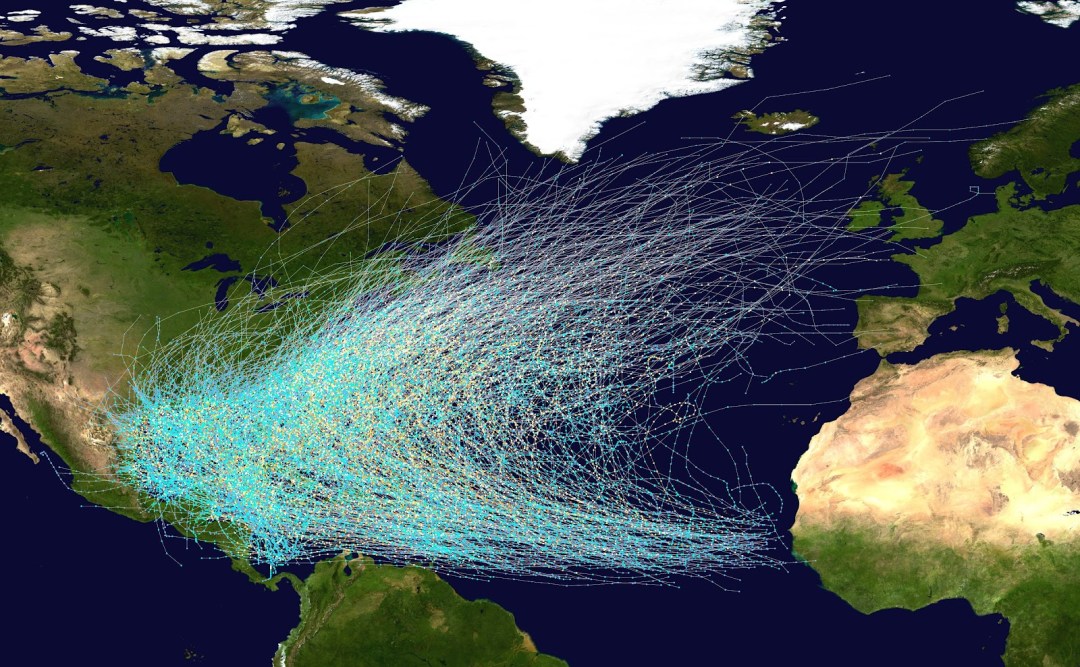
The trajectory of hurricanes is determined in part by Earth’s rotation, so they predictably move from East to West rising gradually in latitude along the way. A large area of high atmospheric pressure usually present around the Bermudas (the Bermuda high) causes the hurricanes to swerve northwards and then continue to move toward the North-East following the Gulf currents. The regularity of these conditions gives hurricanes a somewhat predictable trajectory as the map below shows.

This is only a very crude summary of a vast and detailed body of knowledge scientists have accumulated about the formation of hurricanes. But in spite of all that knowledge and a great deal of technology enabling storm monitoring in real time, we can never be sure about which disturbances will grow into hurricanes and which ones will dissipate or pass with only minor rainstorms. The structure of hurricanes is largely variable and can change from one day to the next leaving scientists unsure about how exactly all the factors in the atmosphere interact to cause hurricanes to gain or lose strength.
Modelling the storms
Mind numbing advances in computer modelling of the storms have enhanced meteorologists’ ability to work out probable outcomes, but not accurate prediction. Weather forecasting models used by meteorologists today fall in three distinct categories:
- statistical models,
- dynamical models
- hybrid statistical-dynamical models.
Statistical models start with the information such as a storm’s location and the time of the year to make a prediction based on previous observed storms at the same location and at the same time of the year. Such models are based on the assumption that over the next 24 or 48 hours, the present storm will behave similarly to the previous ones. Dynamical models analyze all the available information about the storm and its adjacent weather conditions and use the basic laws of fluid dynamics in the Earth’s atmosphere to forecast the future development of the storm. Concretely, scientists use six specific mathematical equations to describe the Earth’s atmosphere: three hydrodynamic equations that rely on Newton’s second law of motion to find horizontal and vertical motions of air caused by air pressure differences, gravity, friction, and the Earth’s rotation; two thermodynamicequations that calculate changes in temperature caused by water evaporation, vapor condensation and similar occurrences; and one continuity equation that accounts for the volume of air entering or leaving the area.
Building up the monitoring grid
With the rapid evolution of computer technology, scientists could handle increasing levels of complexity these equations entail. They have advanced by modelling the Earth’s atmosphere as a three-dimensional grid consisting of a number of horizontal data points stacked in a number of atmospheric layers. One of the first such models was developed in the mid-1950s by the US Weather Bureau. Its grid was rather crude, consisting of a single level of the atmosphere at about 18,000 feet (5,500 meters) and data points spaced 248 miles apart. In the 1970s and 1980s, the Hurricane Center developed a much more complex model consisting of ten layers of atmosphere with grid points 37 miles apart. At the time, computers couldn’t handle this model’s complexity over a large area, so the grid had to move about with the storm, keeping it in the center of an area covering 1,860 miles on each side (it was called the Movable Fine Mesh model).
In the 1990s, the Geophysical Fluid Dynamics Laboratory (GFDL) within the National Oceanic and Atmospheric Administration research center in Princeton, New Jersey developed a model that analyzed data at 18 levels of the atmosphere within three nested grids, the finest of which covered an area of 345 square miles with data points 11.5 miles apart. GFDL’s model thus consisted of some 16,200 points receiving data in time steps of 15 seconds. Even at such fine resolution, the model could only represent a hurricane with an idealized vortex structure based upon only a handful of parameters of the real storm (maximum winds and the distance of maximum winds from the storm center).
In parallel, the US Navy developed its own, somewhat less detailed model named Navy Operational Global Atmospheric Prediction System (NOGAPS). NOGAPS consisted of a horizontal grid resolution of about 52 miles with 45 data points in each layer over an area covering 345 square miles. Running on the Cray C90 supercomputer, NOGAPS took about 20 minutes to produce a 24-hour forecast. If the NOGAPS model were run with the finer grid of the GFDL model, it would require about a week’s time to produce a 24-hour forecast.
Since the late 1990s, further advances have taken place both in increased model resolution,[1] speed of computation and processing capacity. Nevertheless, the practical reality of the problem seems to be converging upon the theory (of computation): as computer models of storms have gone from cruder to finer grid resolution, their complexity has increased exponentially requiring exponentially greater computing power to produce timely forecasts. But the fatal flaw of computer modelling is not only in the resolution of models or in the processing speeds of computers.
The brick wall of complexity
An impossible problem also lies in the complex models’ sensitivity to input data. Namely, very small differences in the values of initial variables can lead to very large variations in outcomes. The seemingly insurmountable theoretical problem in modelling complex systems was discovered by MIT’s theoretical meteorologist Edward Lorenz. Lorenz developed a relatively straightforward computer model emulating weather. One day in 1961, Lorenz resolved to rerun the results of one particular simulation starting at the half-way point, using the results he had for that particular point in his print-outs. The new simulation quickly started diverging from the original results and soon bore no resemblance to it.
The ultimate explanation for this divergence had profound implications for science: while Lorenz’s program took its calculations to six decimal places, his print-outs only showed the values to three decimal places. The minute difference between say, 1.234567 and 1.235 applied in the second simulation led to very large differences in the final results. Lorenz termed this phenomenon, “sensitive dependence on initial conditions.” We have every reason to expect that other complex systems will display a similar sensitivity, implying that the problem of accuracy of measurements poses another stumbling block in science’s attempt to get to the bottom of such systems. Indeed, accurate prediction will likely remain unattainable in spite of continued advances in all areas of research.
As Bob Sheets, the former director of the National Hurricane Center in Miami put it, “The grid for the computer models does keep getting smaller and smaller, but we’re still taking in terms of miles, while the actual weather is taking place at the level of molecules.” [2]
Hurricanes, like markets and economies are complex systems – domains where our efforts to predict a system’s behaviour are up against a brick wall of complexity. For traders and investment managers, as well as for policymakers, this should have sobering implications, suggesting that the whole business of economic forecasting amounts to educated guesswork at best. At worst, it could be less than useless as I tackled from a different angle in an earlier article.
The above article is an excerpt from my 2016 book “Mastering Uncertainty in Commodities Trading” which was rated #1 book on FinancialExpert.co.uk list of “The 5 Best Commodities Books for Investors and Traders” for 2021 and 2022.

Alex Krainer – @NakedHedgie has worked as a market analyst, researcher, trader and hedge fund manager for over 25 years. He is the creator of I-System Trend Following, publisher of TrendCompass reports and contributing editor at ZeroHedge based in Monaco. His views and opinions are not always for polite society but they are always expressed in sincere pursuit of true knowledge and clear understanding of stuff that matters.
BOOKS & LINKS:
- “Alex Krainer’s Trend Following Bible” (2021)
- “Grand Deception: The Truth About Bill Browder, Magnitsky Act and Anti-Russia Sanctions” (2017) twice banned on Amazon by orders of swamp creatures from the U.S. StateDepartment.
- “Mastering Uncertainty in Commodities Trading” (2016) was rated #1 book on commodities for investors and traders by FinancialExpert.co.uk
- WEBSITE: ISystem-TF.com
- BLOG: TheNakedHedgie.com
- YOUTUBE CHANNEL: MARKETS, TRENDS & PROFITS
- LinkedIn: linkedin.com/in/alex-sasha-krainer-0b74ab1a
Notes:
[1] In 2007, NOAA’s WHRF modelling system was adopted by the National Hurricane Center as one of its main numerical guidance models using grid-points only three kilometers apart.
[2] Sheets, Bob and Jack Williams. “Hurricane Watch.” New York: Vintage Books – 2001.

3 thoughts on “Hurricane science for investors and traders”