The most fundamental determining fact in connection with organization is the meeting of uncertainty. The responsible decisions in organized economic life are price decisions; others can be reduced to routine
Frank Knight, “Risk, Uncertainty and Profit”
Over the years I’d written many articles suggesting that price forecasting based on market fundamentals is a waste of time – if not something worse. In polite society, this is not a popular claim, so David Zervos’ statement that studying economic data was a “colossal waste of time,” came as a bit of a redemption. But while Zervos’ statement (see below) reflects the more recent economic upheavals, I’ve kept a critical eye on price forecasts for over 20 years.
“Spending time looking at economic data releases or focusing on corporate earnings is a colossal waste of time” – David Zervos, Managing Director of Jefferies, 11 May 2020.
Forecasting the price of oil
Oil is the world’s most closely studied commodity in the world. Every year, the U.S. Energy Information Administration (EIA), publishes an exhaustive report titled “International Energy Outlook” that includes long-term price forecasts from the EIA and from a group of the industry’s leading research institutions. In 2003, when the oil price started its remarkable ascent to new historical highs, the EIA two-year forecasts all clustered around the low $20s per barrel:

Later, the EIA gave up on accurate forecasts and began reporting their forecasts as a broad range between high and low price projections. With such a broad brush, spanning over $70/bbl by the 2020s, there would be a better chance of getting the right answer. But even that approach failed. The chart below shows EIA’s 2014 long-term forecast:

EIA’s broad-brush approach (as broad as $70/bbl in the 2020s) has been badly wrong almost from the day it was published and it’s been mostly wrong for over seven years since 2014!
LSPEs (large-scale price events): the greatest risk and the greatest opportunity
Crude oil price chart after 2003 shows a sequence of large-scale price events followed by periods of consolidation. Experience has shown that extreme price events represent the greatest source of risk for oil-related businesses. For example, when oil prices collapsed by over 70% from mid-2014 through 2015, the losses sustained by the US mining industry (which includes oil and gas producers) wiped out more than eight previous years’ worth of profits. The 40% price drop in 2018 and the repeat 70% drop in 2020 have also inflicted devastating losses on many industry participants.
Risk = opportunity
What’s important to recognize however, is that risk is the flip-side of opportunity: if LSPEs are the greatest source of risk, they are also the greatest source of potential profit. To draw advantage from LSPEs and avoid being crushed by them, market participants need to learn how to navigate them.
“One thing I have learned over time is the best thing to do is let market price action guide your decision-making and then try to understand the fundamentals as they become more evident and comprehensible.”
Paul Tudor Jones (May 2020 newsletter)
Three reasons forecasters fail to predict major price events
There are three key reasons why conventional approaches to market analysis regularly fail to predict major price events:
(1) Availability and quality of data
The way economic data is collected, tallied, interpreted and presented is always a process that can be somewhat complex, that’s based on numerous assumptions, is always error prone to some degree and involves a time delay. As a result, analysts inevitably deal with partial and approximate representations of a given market.
(2) The unit of account conundrum
Prices and forecasts are always expressed in some unit of account – US dollar, yen, euro, etc. This currency is usually assumed to be a solid foundation on which to measure the relative worth of output, consumption and investment. But currency is itself subject to fluctuation and can affect the nominal price of assets and commodities.
Even if the supply and demand of any given commodity were fixed in perfect equilibrium, its price would likely still fluctuate because of the changes in relative value of the currency.
Take the example of oil again. Oil prices are usually expressed in US dollars per barrel. While it would be difficult to measure US Dollar’s impact on oil prices, we can easily measure their correlation. Over the past 20 years, there’s been an almost 80% inverse correlation between the US Dollar Index and the price of crude oil: as the dollar weakened, oil prices have tended to go up and as it strengthened, oil prices tended to fall. The relationship is quite apparent when we plot the two time series together:

Thus, the relative strength of the US dollar has represented the single greatest influence on oil prices. This implies that, to try and forecast future price fluctuations, oil market analysts must also take into account the state of US economy, inflation, Federal Reserve’s monetary policy, government’s fiscal policies, etc. The sheer complexity of these factors’ interrelatedness easily overwhelms anyone’s ability to digest them.
(3) Groupthink among the forecasters
In January 2019, Reuters asked over one thousand energy market professionals to predict future oil prices. These experts thought that the barrel would average between $65 and $70 through 2023, close to where it was trading at the time. Just like the EIA 2003 example, this forecast reflects the groupthink that often prevails among well respected analysts.
Namely, forecasts affect their authors’ reputations. The farther they stray from the crowd, the greater the risk: if they get it wrong, and not just by a little bit, they could be subject to ridicule or worse. Thus, even if in 2003 some bold analyst correctly estimated that oil prices would more than double through 2005, their firm would be unlikely to publish such a forecast. From an institution’s point of view, it’s better to be wrong along with everyone else.
Trend following is the only valid answer to the problem of uncertainty
Given that timing and direction of extreme price events are unpredictable, how can we master the resulting uncertainty and turn this source of risk into profits? The answer lies in the very nature of market price fluctuations.
Extreme price events almost invariably unfold as trends. They can span many months or even years, enabling us to capture value from them using systematic trend following strategies. The chart below shows how I-System strategies performed trading Brent Crude Oil from January 2014:

The above set of 12 I-System strategies generated a profit of over $166/bbl from 2014 through 22 July 2022. This was not a backtest simulation but the result of trading decisions generated in the real time by I-System trend following strategies. The decisions were based exclusively on the analysis of price fluctuations with no attempt at analyzing market fundamentals or making any price forecasts.
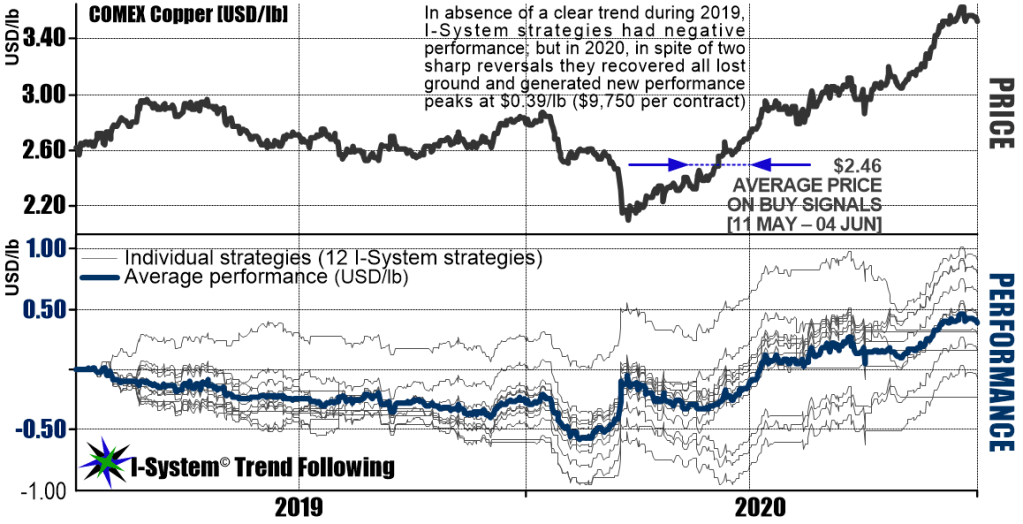
Trend following works in almost any market
The ability to apply the same set of tried and tested rules in any market represents one of the most valuable advantages of systematic trend following. Here are a few examples of our trading performance using I-System Trend Following strategies:
The next chart shows our long-term performance in Palladium (in USD per troy ounce):

Price of the US 10-year Treasury Note is perhaps the most important price in the world as it determines the interest rates on US dollars and thereby impacts all other markets. Between 202 and 2023, US treasuries have sustained the greatest bear market on record, spanning 236 years. Such an event could hardly be predicted but nevertheless, our strategies captured significant windfalls in spite of the fact that our exposure shifted from net long to net short fully seven times as the chart below illustrates (net exposure by 12 I-System strategies is shown in the middle panel where 12 indicates full long exposure and -12 full short exposure):

The ability to use the same decision framework in any market allows us to diversify into many uncorrelated markets, including metals, energy and agricultural commodities, even if we don’t know everything about them. Such diversification may be the only kind of free lunch in investment trading, because it enables similar investment returns with less risk or greater returns at similar levels of risk.
Read more about trend following…
Sign up for a 1-month free trial of I-System TrendCompass!
One of the best trend following newsletters on the market, I-System TrendCompass delivers consistent, dependable and effective decision support daily, based on I-System trend following strategies covering over 200 key financial and commodities markets with no dilution in quality or focus.
- Cut the information overload
- Get real-time CTA intelligence in seconds per day
- Never miss a major trend move
- Navigate trends profitably, with confidence and peace of mind
One month test-drive is always on us. Sign up for a 1-month FREE trial by e-mailing us at TrendCompass@ISystem-TF.com
To learn more, please visit I-System TrendCompass page.

3 thoughts on “Trend following: the only valid answer to the problem of uncertainty”