Our Major Markets portfolio consists of 180 trend following strategies (long, medium and short cycle trends) in 15 of the most important markets for global investors. Daily TrendCompass reports convey the directional exposure and trading signals for all these strategies. Here we’ll look at the performance of these signals from the start of 2020 through Friday, 19 March 2021 (this is not a backtest simulation). To make the results meaningful and comparable, they are based on an equal risk weighting for each market. For the whole portfolio, the results were as follows:

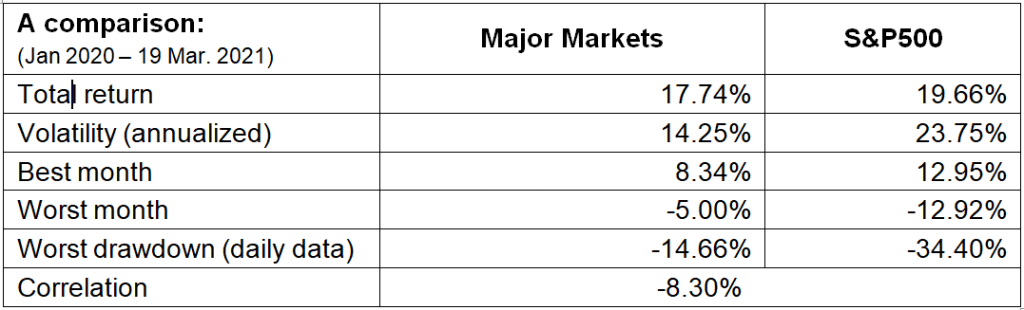
Thanks to its broad diversification, the Major Markets portfolio was significantly less volatile than the S&P 500. Its biggest draw-down was 14.66% vs. 34.4% for the S&P500. It is precisely the March/April 2020 market jolt which best reflects the advantages of a well-diversified set of high quality trend following strategies: rather than sustaining large losses during that time, we experienced only a limited decline followed by a quick recovery. In a real bear market, we would have seen continued strong positive performance!
By “real bear market,” I mean the kind that followed the bursting of the 1980s Japanese or 1920s American stocks bubbles: losses exceeding 80% and the recoveries spanning 3 decades or longer (the Nikkei is still 30% below 1989 peaks). The following table compares some risk/reward attributes of the Major Markets portfolio and the S&P500 over the same time period:
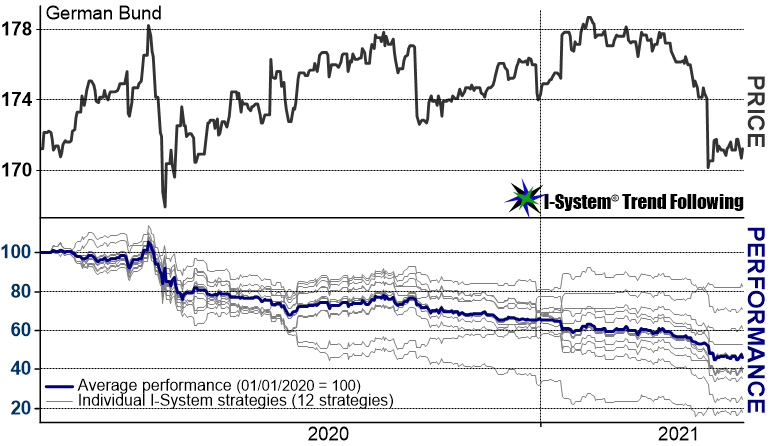
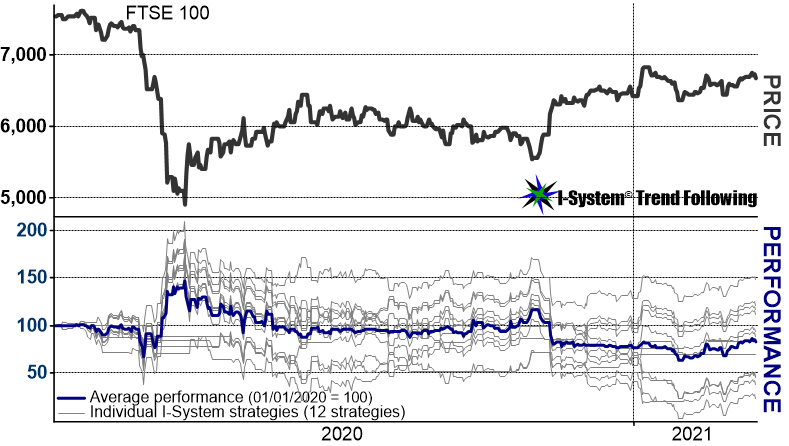
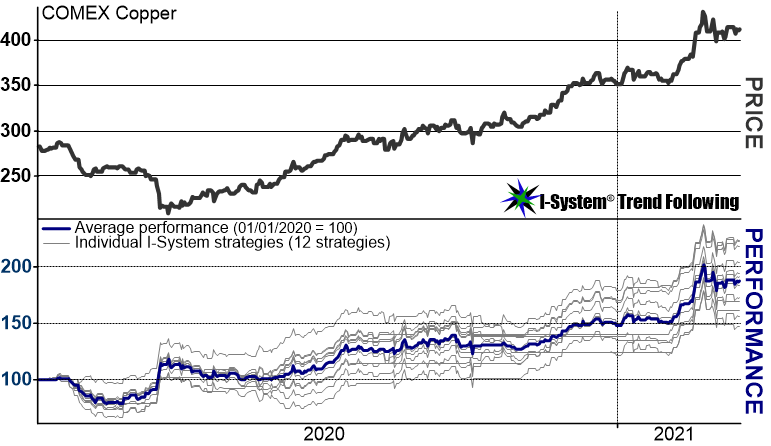
The charts that follow break down this performance and show it visually per market and per strategy:
Part 1: CURRENCY PAIRS


Part 2: TREASURY FUTURES


Part 3: EQUITY INDICES


Part 4: ENERGY


Part 5: METALS


Part 6: THE WHOLE PORTFOLIO
Keeping approximately the same risk exposure in all of the above 15 markets would have generated the following performance (after all the commissions on trades and roll-overs paid):

On position sizing and its effect on performance in individual markets: risk weighting is based on short-term price fluctuations: the more volatile the markets we trade, the smaller our position sizes. For this reason, the U.S. 10-year T-Note (TY) turned out to be our best performer: since it is less volatile than the 30-year Bond, TY position was a bit larger. But as longer-term price changes were similar in both markets, TY generated greater profits. The issue is that we can easily measure the volatility of short-term price fluctuations, but we can’t predict large-scale price events.
Part 7: CONCLUDING REMARKS
In the above simulation, Major Markets portfolio was significantly less volatile than the S&P 500. More importantly, its biggest draw-down was 14.66% vs. 34.4% for the S&P500. It is precisely the March/April market jolt which best reflects the merit of a well-diversified set of trend following strategies. Rather than sustaining large losses during that time, we experienced only limited decline followed by a quick recovery. In a real bear market, we would have seen continued strong positive performance! Here’s what I mean by “real bear markets”:


I-System’s ability to implement thousands of intelligent trading strategies in over 200 financial and commodity markets with no dilution of quality or focus is the reason I believe I-System truly is the very best trend following model ever built. As we head into the new commodity super-cycle and stocks stand at the peak of the ‘everything bubble’ investors can benefit from I-System strategies through our TrendCompass reports.
For investors accustomed to the riveting stories about Bitcoin, Tesla and similar hockey-stick assets, systematic trend following may not seem as exciting. However, trend following is a serious long-term strategy for serious investors. It takes the guesswork out of investing with quality decision support that allows investors to navigate the uncertain future profitably, with confidence and piece of mind.
Sign up for a 1-month free trial of I-System TrendCompass!
One of the best trend following newsletters on the market, I-System TrendCompass delivers consistent, dependable and effective decision support daily, based on I-System trend following strategies covering over 200 key financial and commodities markets with no dilution in quality or focus.
- Cut the information overload
- Get real-time CTA intelligence in seconds per day
- Never miss a major trend move
- Navigate trends profitably, with confidence and peace of mind
One month test-drive is always on us. Sign up for a 1-month FREE trial by e-mailing us at TrendCompass@ISystem-TF.com
To learn more, please visit I-System TrendCompass page.
