
As we approach the autumn season, the charts of both Gold and Silver look very interesting, suggesting that over the next few months we could see very significant price events in both precious metals. I base this purely on my reading of Gold and Silver price charts but I’ll also address some unprecedented anomalies in the global markets which could constitute explosive rocket fuel for Gold and Silver prices. Below is a condensed, 13-min. video report. The article with charts continues below.
Silver: a tactical buy.
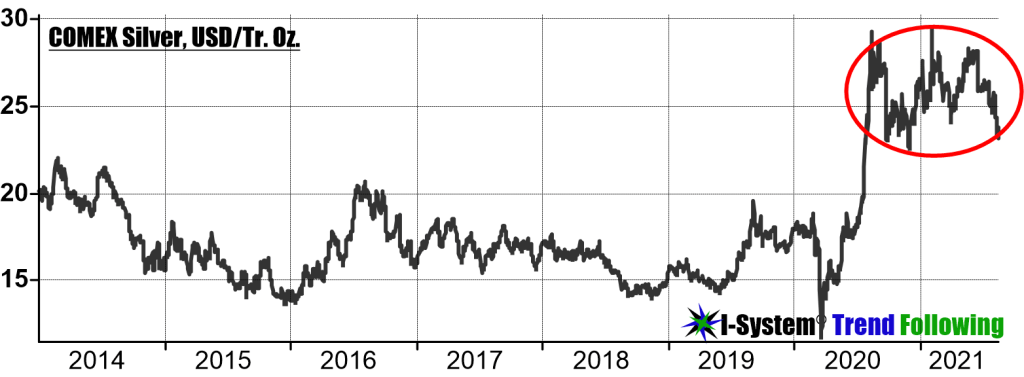
For nearly eight years now, Silver has not trended much which made it a difficult to trade. The price chart itself is not easy to read, apart for the change that happened on the back of last year’s sharp rally and the subsequent consolidation that has now lasted a full year. If we zoom into this interval, we can see that Silver did start discretely trending from the end of 2018. This trend was interrupted by the sharp crash in March last year, but from there Silver has bounced back and rallied to nearly 30 dollars an ounce.
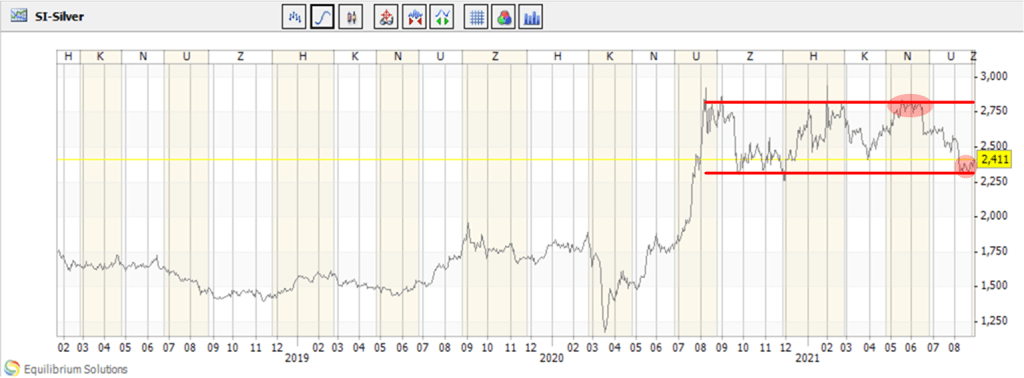
Over the past 12 months Silver has fluctuated sideways, bouncing repeatedly below the horizontal resistance level at about $27.50 – $28. Then through May and June this year, the price remained almost glued to that resistance level making it look like it wanted to break out higher. In one of my TrendCompass reports at the time I commented on this situation and warned my subscribers that it is never a good idea to trade in anticipation of market moves because they frequently fail. Well, Silver’s push against the resistance at $28 did fail and now we’ve had a substantial pullback which had reached the very bottom of its horizontal consolidation channel at about 23 dollars. Over the last three weeks, it has also completed a small double-bottom formation which could signal that the pullback has run its course. This all suggests that Silver is a good tactical buy: its upside could be wide open and on the down-side you can set a stop-loss below 23 dollars.
Gold: bullish, but a wait-and-see market

Turning to Gold, we have a much clearer picture: gold price has trended higher since 2018, gaining some $800/Tr.Oz. when it peaked last August. Since then the trend has stalled and consolidated. If we zoom in we see that Gold has formed a downward sloping channel but with a rather weak support.
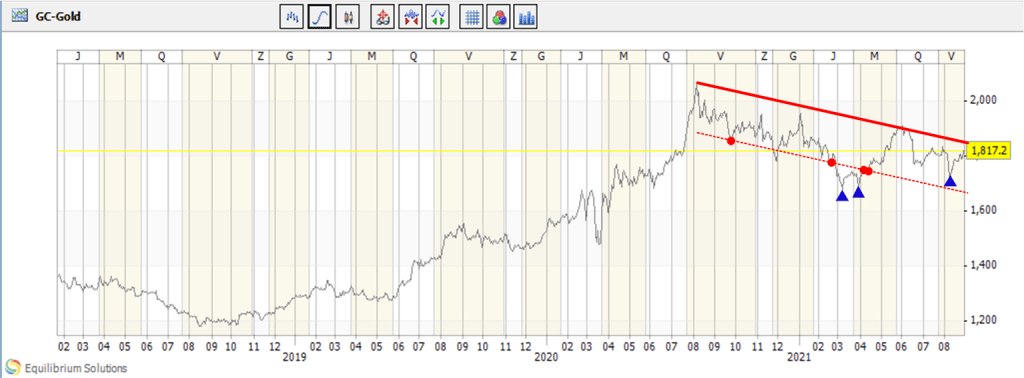
In general these downward sloping channels tend to have bullish implications suggesting that the previous trend will likely resume at some point. What is more encouraging still is the fact that this year each significant correction has found higher support which suggests that selling pressure is being overturned by buying pressure at higher and higher levels. This could be an indication that Gold is gathering momentum to resume its upward trend towards new price highs. But having said all that, I must also point out that unlike Silver, Gold chart hasn’t produced a clear BUY signal at the current levels – it is still fluctuating in the middle of its consolidation channel and for now it’s probably better to wait to have a clear breakout from the current pattern, or to buy into a major pullback. Gold price is still vulnerable to flash-crashes as we have seen during the first week of August when someone dumped 24,000 COMEX Gold contracts in the space of one hour. This risk is real, so it’s best to tread carefully.
Structural imbalances and their impact
But I did want to address some market anomalies which could see Gold and Silver prices explode much, much higher at some point in the near future. Namely, we are now facing a confluence of a number of factors, all of which are compounding uncertainty and volatility in many global markets. I recently posted an article discussing the meaning and implications related to the recent events in Afghanistan (for a 14-min. video report click here) which are certain to have very far-reaching repercussions. Some of these are already unfolding at a very rapid pace. For reasons that go beyond this discussion, I believe that the future will see much higher interest rates, higher inflation, rising commodity prices and rising uncertainty.
Another important factor is that since the 2008 financial crisis, the leading central banks around the world have been flooding the economies with liquidity that has flowed mostly into traditional asset classes like stocks and bonds, pushing them to all time record highs in many markets. At the same time, commodity prices have remained relatively depressed, dropping recently to an all-time lows relative to stock prices

But even within the commodities complex, the precious metals have themselves been relatively depressed and recently hit a 13-year low as the following chart illustrates, courtesy of Crescat capital.

Relative to historic norms, the current market conditions do seem very anomalous, suggesting that we could see very significant price readjustments in the medium- to long-term future, and these events could prove more extreme than what we experienced in the past. In the grand scheme of things, the markets for Gold and Silver are relatively small. Estimates vary, but the full market cap for all the commercial gold in the world is between $5 and $6 trillion. Here’s how they arrive at that number: the world’s entire gold inventory – all of the above-ground physical gold is estimated to be between 5.7 and to 6.1 billion ounces. At the current prices, that’s between $10 and $11 trillion. But about half of this gold is in the form of jewelry so it has no commercial use. Therefore, the remaining half: between $5 and $6 trillion, represents the full market cap of all the commercial gold in the world – an amount that’s dwarfed by global equity markets which have now reached nearly 120 trillion dollars. Most of that is controlled by the global shadow banking system which is estimated at about 200 trillion.

Because Gold and Silver have remained depressed relative to other commodities, and even more so relative to stocks and bonds, the precious metals have not been in vogue with investors. But fashions do change and when the markets again acquire an appetite for gold and silver, we could see very substantial price readjustments. The massive pool of liquid assets that’s flooded into one market after another partly explains some of the explosive price increases we have seen over the recent years.

A fascinating case last year was the lumber futures (see lower left chart above): for 25 years, lumber prices have fluctuated between $200 and $400 per 1 thousand board feet – that’s been a very stable range – but in 2016 lumber price started trending and reached a new historical high at $600. After a sharp correction it resumed rising in a trend that rapidly went vertical, adding fully $1,200 in only one year’s time. Lumber prices came back down almost as quickly as they went up (so did the rice futures), but the point is that over the recent years the markets have increasingly manifested very sharp, extreme price events that seem unprecedented and could not have been predicted in advance.

This is what Bitcoin price chart looked like mid-way through 2020. Just just a few months later, it looked like this.

Who knew? But again, we did see a trend gradually forming through 2020, and when a critical mass of investors decided they wanted to get into Bitcoin the trend sharply accelerated, again going almost vertical. I see no reason why investors could not, some day in the near future, decide that Gold and Silver are the place to be. At that point we might see the precious metals vault far higher than we can anticipate today. Remember, during the inflationary 1970s, the price of gold rose from $35/Tr.Oz in 1971 to $850 in 1980 – a twenty-four fold rise. Whether we’ll see a similar scenario in the coming years, nobody can tell, but I believe the opportunity is there and all things considered, it does seem very compelling.
We can’t predict WHEN the prices might begin to move, or how fast they will rise, but the one thing we know for sure is that large scale price events almost invariably unfold as trends which can months and years. Systematic trend following is the most reliable way to navigate them. One of the best daily trend following newsletter is I-System Trend Compass published by yours truly. For more information, please follow this link.
In all, Silver already looks like a tactical buy at the current levels (just under $24/tr.oz., as of today, 2 Sep. 2021), and Gold might offer one in the near future (either upon a breakout from the current consolidation pattern, or a substantial pull-back). Structural imbalances in the markets, which could catalyze very substantial price readjustments could see both precious metals follow in the footsteps of the many hockey-stick rallies we’ve seen over the recent, QE years. Even for those who think Gold and Silver are boring, I believe that the present situation is compelling enough to start paying attention.

Sign up for a 1-month free trial of I-System TrendCompass!
One of the best trend following newsletters on the market, I-System TrendCompass delivers consistent, dependable and effective decision support daily, based on I-System trend following strategies covering over 200 key financial and commodities markets with no dilution in quality or focus.
- Cut the information overload
- Get real-time CTA intelligence in seconds per day
- Never miss a major trend move
- Navigate trends profitably, with confidence and peace of mind
One month test-drive is always on us. Sign up for a 1-month FREE trial by e-mailing us at TrendCompass@ISystem-TF.com
To learn more, please visit I-System TrendCompass page.
