In April 2012, economist Robert Wenzel was invited to speak at the Federal Reserve Bank of New York. On the occasion, he told the central bankers that “vast amounts of money printing are now required to keep your manipulated economy afloat. It will ultimately result in huge price inflation, or, if you stop printing, another massive economic crash will occur. There is no other way out.”
The money supply tsunami
Mr. Wenzel was right and after an attempted quantitative ‘tightening,’ and a 20% market crash in Q4 2018, the Fed capitulated and resumed money printing. That program has now sharply accelerated.

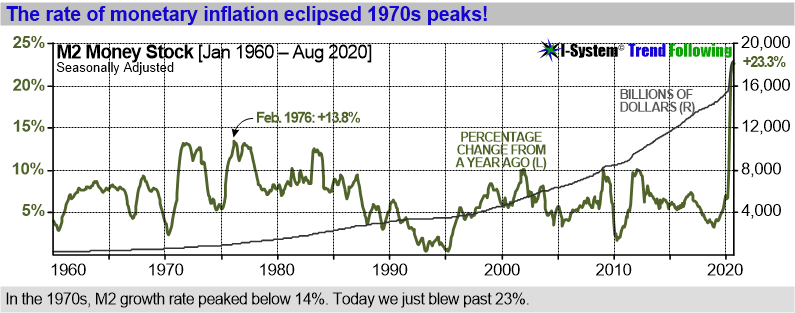
M2 money supply [3] is perhaps the most important early indicator of price inflation. In 2020, the Fed added almost $3.5 trillion to the aggregate. The transition is more striking still, in percentage terms:
Price inflation inertia
The relationship between money supply and price inflation is not linear; price inflation tends to move with some inertia. The 1970s inflation was preceded by the “Great Prosperity” of the 1960s: monetary expansion began in October ‘62 and continued through 1969. While money supply increased by 38% during that time, prices rose only 11% from April ‘62 to September ‘69. This inertia of price inflation convinced the era’s “New Economists” that inflation was a thing of the past. But inflation did emerge, only with a delay.

Velocity of money and human psychology
As new money enters circulation, there is a corresponding drop in money velocity since households don’t change their spending habits right away. They tend to use it to pay down debts and increase their savings so initially there is little upward pressure[4] on prices of goods and services. However, prices ultimately do catch up and when they begin to rise, velocity reverses course. From that point on price inflation begins to accelerate.
Gestation and the eruption of 1970s inflation
After seven years of growth fueled by deficit spending and credit expansion, U.S. economy began to overheat in 1969 and price inflation reached almost 5%. Nixon administration responded by instituting a tight money regime and extreme budget cutting. This led to a sharp recession.
A wave of mass layoffs and business bankruptcies spooked the government to abruptly reverse itself once more once more and increased deficit spending in the summer of 1970. Federal Reserve ramped up monetary inflation rate to 6.5% and the outlook quickly brightened again: interest rates plunged, stock markets soared and the nation was back on the high road to “prosperity.” But by now inflation began to accelerate and in 1974, it reached 11% and stayed high for the rest of the decade.
Destruction of wealth
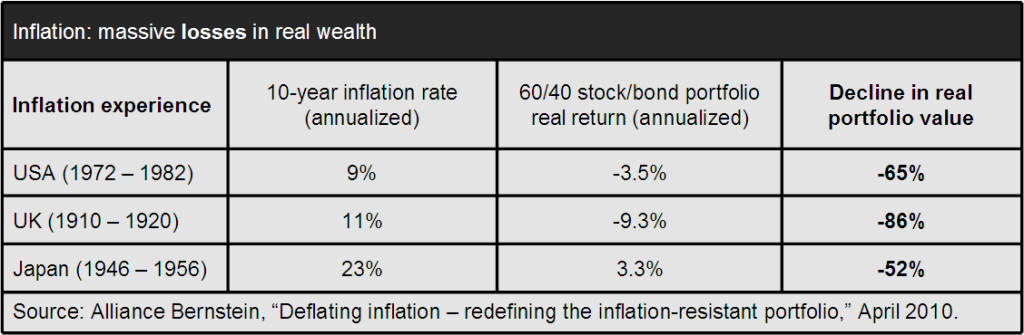
Warren Buffett warned that for a debtor nation, inflation is the economic equivalent of the hydrogen bomb. It is the most formidable destroyer of wealth. Since 1960 over two thirds of the world’s market economies suffered episodes of inflation which exceeded 25% in at least one year.[2] On average, investors lost 53% of purchasing power during such episodes. In the U.S. between 1972 and 1982, price inflation averaged a “moderately high” 9% per year. It destroyed 65% of investors’ wealth in real terms.
What could trigger price inflation and when?
Although we can’t predict inflation’s timing or severity, history suggests that significant changes in inflation almost always come as a surprise. Ordinarily, three key factors act as economic flame retardants that absorb price inflation pressures:
- Asset price inflation: by initially absorbing most of the newly created money, financial assets deflect the pressure on prices of goods and services.
- Current account deficit has enabled the US to export its excess dollars to other nations (most notably China) and obtain cheap goods, keeping consumer prices low.
- Human psychology is slow to change inflation expectations, keeping money velocity low for a time.
Unforeseen changes in either of these elements could trigger a phase change in price inflation. Even a moderate increase in interest rates could burst the asset price bubble; economic protectionism and a breakdown in international trade could close the current account deficit, and a rise in commodity prices could boost inflation expectations and the money velocity.
Offshore dollars: another risk factor
Many people wonder why Japan, with its massive QE program hasn’t experienced any price inflation (yet)? The key difference between Japan and the U.S. is that the dollar is much more vulnerable to the actions of foreign creditors. In 2019, only 12% of Japan’s debt was held in non-resident (foreign) ownership. At the same time, 41% of U.S. debt was foreign-owned. In dollar amounts, foreigners hold at least $25 trillion in dollar denominated securities, short-term paper and offshore bank deposits. This is more than the entire U.S. M2 money stock! As Jens Parsson wrote in Dying of Money: “The economics of disaster commences when the holders of money wealth revolt. … Foreign holders of the money take fright … and their money elbows its way into the markets and reverses any balance of payments deficit.”
Will it be like the 1970s or could it be worse?
Economic imbalances that caused the 1970s inflation were mild compared to today’s conditions. Today, the trade balance, fiscal deficits, public and private debts, as well as money supply growth are much larger than they were in the 1960s. Even through the inflationary 1970s, the money supply growth remained below 14%. This year, we already blew past 23%. Predicting how these imbalances will play out is quite out of the question, but the risks are very serious and investors should consider taking bold action to protect their wealth from the ravages of inflation.
Commodity futures: the best way to protect your wealth
Empirical evidence shows that of all the asset classes, commodity futures provide the best inflation protection. For example, Alliance Bernstein research found that “managed futures” (i.e. exposure to commodity futures prices) had the highest inflation beta of all asset classes:

A paper titled, “Assessing Managed Futures as an Inflation Hedge Within a Multi-Asset Framework,” published in the Journal of Wealth Management concluded that, “Managed futures outperform the other asset classes… No other asset class presents itself as a viable inflation hedge.”[6]
Indeed, as inflation erodes money’s purchasing power, commodity prices can rise very significantly. For example gold appreciated by 2,300% during the 1970s, from $35/tr.oz in 1971 to $850 in 1980. Inflation is likely to have a strong impact on other commodities as well, including energy, industrial metals and agricultural staples like wheat, soybeans, sugar, coffee, cotton and others.
Commodities: overdue for a major price readjustment?
In fact, a significant readjustment in commodity prices could be well overdue. Since the last financial crisis, the price of commodities has fallen to new historical lows relative to stock prices.

Just by reverting toward their historic norm, commodity prices could increase multi-fold. This process will likely unfold as a multi-year trend, offering perhaps a generational opportunity for investors to diversify their risk away from overinflated assets and gain a meaningful inflation protection at the same time.
An effective, reliable solution is at hand
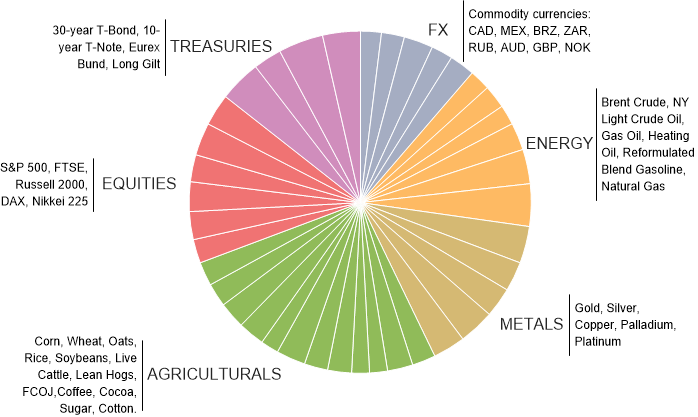
For qualified investors, Krainer Analytics can propose competitively priced turn-key solutions that include an effective inflation hedge: a broadly diversified managed futures portfolio covering more than up to 100 financial and commodity futures markets with an accurately gauged risk profile and position limits in each market.
How does it work? A DIY solution could be a bit like IKEA furniture: we do all the designing, measuring and cutting, but you do the assembly and the trading. From us, you’ll receive daily trades to execute, based on a large set of thoroughly tested trend following strategies crafted through the I-System, probably the very best trend following model ever built. For larger allocations, we can equally offer fully serviced managed accounts through one of our regulated partners. We’ve managed this very process for over 15 years and outperformed even the best among the managed futures funds.
Our portfolio solutions are always based on precisely formulated, documented and thoroughly tested set of rules. Developing such solutions in-house can be prohibitively costly and time consuming. Usually, it involves a range of risks, including the ubiquitous model risk. Thanks to the I-System, we can deliver our solutions rapidly, and at a fraction of the cost of using in-house resources.
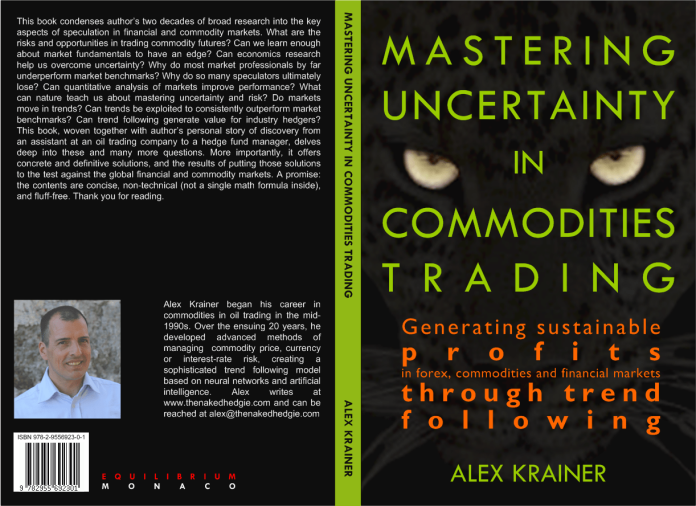
Alex Krainer [xela.reniark@gmail.com] is a former hedge fund manager and author of the 5-star rated book “Mastering Uncertainty in Commodities Trading” and creator of I-System, probably the best trend following system ever built. Alex conducted deep research into the problem of monetary inflation while managing an inflation protection fund from 2011 to 2019 and continues researching monetary issues and economics.
Notes:
[1] https://www.robertwenzel.com/
[2] Robert Wenzel, “My Speech Delivered at the New York Federal Reserve Bank.” Economic Policy Journal, 25 April 2012. http://www.economicpolicyjournal.com/2012/04/my-speech-delivered-at-new-york-federal.html
[3] M2 includes a broader set of financial assets held principally by households. M2 consists of M1 plus: (1) savings deposits; (2) small-denomination time deposits; and (3) balances in retail money market mutual funds (MMMFs). Seasonally adjusted M2 is computed by summing savings deposits, small-denomination time deposits, and retail MMMFs, each seasonally adjusted separately, and adding this result to seasonally adjusted M2. See https://fred.stlouisfed.org/series/M2SL
[4] By contrast, banks and corporations spend much of the new money to buy stocks and bonds or bolster reserves. This exerts upward pressure on financial asset prices.
[5] Stanley Fischer, “Modern Hyper- and High Inflations,” National Bureau of Economic Research Working Paper No. 8930

One thought on “Inflation: we passed the phase transition”